前言
官网指引,生成accesstoken,下载相关依赖请翻阅[https://blog.csdn.net/weixin_44402694/article/details/125414381?spm=1001.2014.3001.5501](https://blog.csdn.net/weixin_44402694/article/details/125414381?spm=1001.2014.3001.5501)
本文使用官网accesstoken,请自行生成私人token
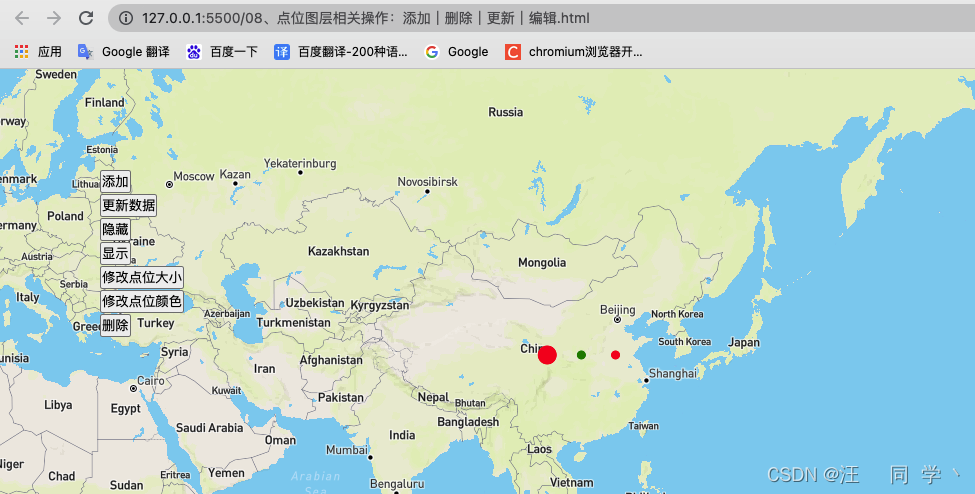
mapbox绘制点图层并进行添加、删除、更新、显隐等操作
效果
代码实现
<!DOCTYPE html>
<html lang="en">
<head>
<meta charset="UTF-8" />
<meta http-equiv="X-UA-Compatible" content="IE=edge" />
<meta name="viewport" content="width=device-width, initial-scale=1.0" />
<title>08、上图点位图层相关操作</title>
<link
href="https://api.mapbox.com/mapbox-gl-js/v2.7.0/mapbox-gl.css"
rel="stylesheet"
/>
<script src="https://api.mapbox.com/mapbox-gl-js/v2.7.0/mapbox-gl.js"></script>
<style>
* {
padding: 0;
margin: 0;
list-style: none;
text-decoration: none;
}
html,
body {
width: 100%;
height: 100%;
}
#map {
width: 100%;
height: 100%;
}
.btn-list {
position: fixed;
top: 100px;
left: 100px;
}
</style>
</head>
<body>
<div id="map"></div>
<ul class="btn-list">
<li>
<button onclick="addPoint()">添加</button>
</li>
<li>
<button onclick="updatePoint()">更新数据</button>
</li>
<li>
<button onclick="hidePoint()">隐藏</button>
</li>
<li>
<button onclick="showPoint()">显示</button>
</li>
<li>
<button onclick="editPointSize()">修改点位大小</button>
</li>
<li>
<button onclick="editPointColor()">修改点位颜色</button>
</li>
<li>
<button onclick="deletePoint()">删除</button>
</li>
</ul>
<script>
let marker = null
mapboxgl.accessToken =
'pk.eyJ1Ijoid2FuZ3Rvbmd4dWUiLCJhIjoiY2pzY3E2M2k0MDk3NzN5dDA0Nmtia2h0cCJ9.oP9fEJxOgVzm0dWGvL6tGg'
const map = new mapboxgl.Map({
container: 'map',
style: 'mapbox://styles/mapbox/streets-v11',
center: [108, 35],
zoom: 2,
})
function addPoint() {
if (map && map.getSource('circle')) {
map.removeLayer('circle')
map.removeSource('circle')
}
map.addSource('circle', {
type: 'geojson',
data: {
type: 'FeatureCollection',
features: [
{
type: 'Feature',
properties: { size: 10, color: 'red' },
geometry: { type: 'Point', coordinates: [104, 35] },
},
{
type: 'Feature',
properties: { size: 5, color: 'green' },
geometry: { type: 'Point', coordinates: [110, 35] },
},
{
type: 'Feature',
properties: { size: 5, color: 'red' },
geometry: { type: 'Point', coordinates: [116, 35] },
},
],
},
})
map.addLayer({
id: 'circle',
type: 'circle',
source: 'circle',
paint: {
'circle-radius': ['get', 'size'],
'circle-color': ['get', 'color'],
'circle-opacity': 1,
'circle-stroke-color': 'red',
'circle-stroke-opacity': 1,
},
})
}
function updatePoint() {
if (!map.getSource('circle')) {
return alert('请先添加')
}
map.getSource('circle').setData({
type: 'FeatureCollection',
features: [
{
type: 'Feature',
properties: { size: 4, color: 'red' },
geometry: { type: 'Point', coordinates: [124, 35] },
},
{
type: 'Feature',
properties: { size: 6, color: 'yellow' },
geometry: { type: 'Point', coordinates: [128, 35] },
},
{
type: 'Feature',
properties: { size: 8, color: 'red' },
geometry: { type: 'Point', coordinates: [132, 35] },
},
],
})
}
function hidePoint() {
if (!map.getSource('circle')) {
return alert('请先添加')
}
map.setLayoutProperty('circle', 'visibility', 'none')
}
function showPoint() {
if (!map.getSource('circle')) {
return alert('请先添加')
}
map.setLayoutProperty('circle', 'visibility', 'visible')
}
function editPointSize() {
if (!map.getSource('circle')) {
return alert('请先添加')
}
map.setPaintProperty('circle', 'circle-radius', 10)
}
function editPointColor() {
if (!map.getSource('circle')) {
return alert('请先添加')
}
map.setPaintProperty('circle', 'circle-color', 'green')
}
function deletePoint() {
if (!map.getSource('circle')) {
return alert('请先添加')
}
map.removeLayer('circle')
map.removeSource('circle')
}
</script>
</body>
</html>


 1128
1128


 被折叠的 条评论
为什么被折叠?
被折叠的 条评论
为什么被折叠?
 到【灌水乐园】发言


