前言
基于echarts5.x和vue2实现
记录以便日后查阅
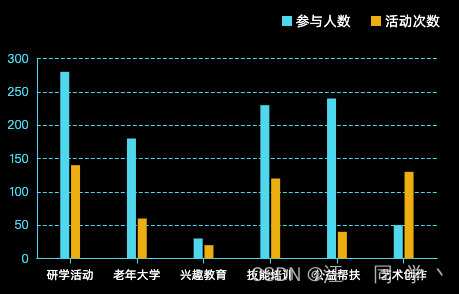
实现效果
代码实现
<template>
<div class="chart-wrap">
<ul class="legend-list">
<li
v-for="(item, index) in yData"
:key="index"
:class="['legend', item.selected ? '': 'un-active']"
@mouseenter="enterHandler(item)"
@mouseleave="leaveHandler(item)"
@click="clickHandler(item)"
>
<i class="rect" :style="{ backgroundColor: item.color }" />
<span>{{ item.name }}</span>
</li>
</ul>
<div id="chart06" class="chart" />
</div>
</template>
<script>
export default {
name: 'Index',
data () {
return {
chart: null,
yData: [
{ name: '参与人数', value: [280, 180, 30, 230, 240, 50], color: '#24DCF0', selected: true },
{ name: '活动次数', value: [140, 60, 20, 120, 40, 130], color: '#F7B500', selected: true }
],
xData: ['研学活动', '老年大学', '兴趣教育', '技能培训', '公益帮扶', '艺术创作']
}
},
mounted() {
this.createChartHandler()
},
methods: {
createChartHandler () {
this.chart = this.$echarts.init(document.getElementById('chart06'))
this.chart.setOption(this.getChartOption(this.yData, this.xData))
window.addEventListener('resize', () => {
setTimeout(() => {
this.chart.resize()
})
})
},
getChartOption (yData, xData) {
return {
tooltip: {
trigger: 'axis',
axisPointer: {
type: 'shadow'
},
extraCssText:
'fontFamily: PingFangReg;color:#fff;background:rgba(0,0,0,0.6000);border: unset;border-radius: 2px;z-index:99',
formatter: (e) => {
const div = document.createElement('div')
div.innerHTML = `
<p style="font-size: 12px">技能培训</p>
${e
.map((i) => {
return `<p style="font-size: 10px;display: flex; align-items: center;"> <span style=\"display:inline-block;margin-right:4px;border-radius:10px;width:4px;height:4px;background-color:${i.color};\"></span> ${i.seriesName}:${i.value}</p>`
})
.join('')}
`
return div
}
},
legend: {
show: false,
data: yData.map((i) => i.name)
},
grid: {
top: '5%',
left: '8%',
right: '5%',
bottom: '15%'
},
xAxis: [
{
type: 'category',
data: xData,
axisLabel: {
interval: 0,
fontFamily: 'PingFangReg',
lineHeight: 17,
fontSize: 12,
color: '#fff'
},
axisTick: {
show: true,
alignWithLabel: true,
lineStyle: {
color: '#24DCF0'
}
},
axisLine: {
show: true,
lineStyle: {
color: '#24DCF0'
}
}
}
],
yAxis: [
{
type: 'value',
interval: 50,
axisLabel: {
fontFamily: 'PingFangReg',
fontSize: 12,
color: '#24DCF0'
},
axisLine: {
show: true,
lineStyle: {
color: '#24DCF0'
}
},
splitLine: {
show: true,
lineStyle: {
color: '#24DCF0',
type: 'dashed'
}
}
}
],
series: yData.map((i) => {
return {
name: i.name,
type: 'bar',
barWidth: 9,
barGap: 0.2,
data: i.value,
itemStyle: {
color: i.color
}
}
})
}
},
enterHandler (item) {
if (!this.chart) return
this.chart.dispatchAction({
type: 'highlight',
name: item.name
})
},
leaveHandler (item) {
if (!this.chart) return
this.chart.dispatchAction({
type: 'downplay',
name: item.name
})
},
clickHandler (item) {
if (!this.chart) return
item.selected = !item.selected
this.chart.dispatchAction({
type: 'legendToggleSelect',
name: item.name
})
}
}
}
</script>


 860
860


 被折叠的 条评论
为什么被折叠?
被折叠的 条评论
为什么被折叠?
 到【灌水乐园】发言


