前言
基于echarts5.x和vue2实现
记录以便日后查阅
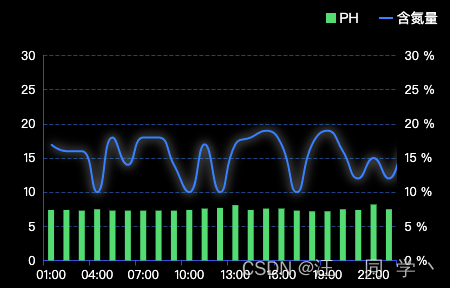
实现效果
代码实现
<template>
<div class="chart-wrap">
<ul class="legend-list">
<li
v-for="(item, index) in yData"
:key="index"
:class="['legend', item.selected ? '': 'un-active']"
@mouseenter="enterHandler(item)"
@mouseleave="leaveHandler(item)"
@click="clickHandler(item)"
>
<i v-if="item.name === 'PH'" class="rect" :style="{ backgroundColor: item.color }" />
<i v-else class="line" :style="{ backgroundColor: item.color }" />
<span>{{ item.name }}</span>
</li>
</ul>
<div id="chart15" class="chart" />
</div>
</template>
<script>
export default {
name: 'Index',
data () {
return {
chart: null,
yData: [
{ name: 'PH', value: [7.4, 7.4, 7.3, 7.5, 7.3, 7.3, 7.3, 7.3, 7.3, 7.4, 7.6, 7.7, 8.1, 7.4, 7.6, 7.6, 7.3, 7.2, 7.2, 7.5, 7.4, 8.2, 7.5, 7.4, 7.2], color: '#45de81', selected: true },
{ name: '含氮量', value: [17, 16, 16, 10, 18, 14, 18, 18, 14, 10, 17, 10, 17, 18, 19, 17, 10, 17, 19, 16, 12, 15, 12, 16, 10], color: '#0091FF', selected: true }
],
xData: ['01:00', '02:00', '03:00', '04:00', '05:00', '06:00', '07:00', '08:00', '09:00', '10:00', '11:00', '12:00', '13:00', '14:00', '15:00', '16:00', '17:00', '18:00', '19:00', '20:00', '21:00', '22:00', '23:00']
}
},
mounted() {
this.createChartHandler()
},
methods: {
createChartHandler () {
this.chart = this.$echarts.init(document.getElementById('chart15'))
this.chart.setOption(this.getChartOption(this.yData, this.xData))
window.addEventListener('resize', () => {
setTimeout(() => {
this.chart.resize()
})
})
},
getChartOption (yData, xData) {
return {
grid: {
top: '5%',
left: '5%',
right: '5%',
bottom: '5%',
containLabel: true
},
tooltip: {
trigger: 'axis',
axisPointer: {
type: 'cross',
crossStyle: {
color: '#999'
}
},
textStyle: {
color: '#fff'
},
formatter: function (params) {
const axisLabel = params[0].axisValueLabel
return `${axisLabel}<br>
<span style="display:inline-block;border-radius:50%;width:10px;height:10px;background:${params[0].color};margin-right:15px"></span><span>${params[0].seriesName}:${params[0].value}</span><br>
<span style="display:inline-block;border-radius:50%;width:10px;height:10px;background:${params[1].color};margin-right:15px"></span><span>${params[1].seriesName}:${params[1].value}%</span>`
},
extraCssText:
'color:#fff;background: rgba(0, 38, 118, 0.5);border:none; box-shadow: 0px 0px 8px 1px rgba(0, 145, 255, 0.5);border-radius: 2px;z-index:99'
},
legend: {
show: false,
data: yData.map(i => i.name)
},
xAxis: [
{
type: 'category',
data: xData,
axisLabel: {
textStyle: {
fontSize: 12,
color: '#fff'
}
},
axisLine: {
lineStyle: {
color: 'rgba(42, 109, 251, 0.79)'
}
}
}
],
yAxis: [
{
type: 'value',
name: 'PH',
min: 0,
max: 30,
interval: 5,
axisLabel: {
textStyle: {
fontSize: 12,
color: '#fff'
}
},
axisLine: {
show: true,
lineStyle: {
color: 'rgba(42, 109, 251, 0.79)'
}
},
nameTextStyle: {
color: '#fff',
fontSize: 12
},
splitLine: {
show: true,
lineStyle: {
type: 'dashed',
color: 'rgba(0,145,255,.3)'
}
}
},
{
type: 'value',
name: '含氮量',
min: 0,
max: 30,
interval: 5,
axisLabel: {
textStyle: {
fontSize: 12,
color: '#fff'
},
formatter: '{value} %'
},
nameTextStyle: {
color: '#fff',
fontSize: 12,
align: 'center',
padding: [0, 0, 0, 0]
},
splitLine: {
show: true,
lineStyle: {
type: 'dashed',
color: 'rgba(0,145,255,.3)'
}
}
}
],
series: [
{
name: 'PH',
type: 'bar',
data: yData[0].value,
barWidth: 6,
itemStyle: {
color: yData[0].color
}
},
{
name: '含氮量',
type: 'line',
yAxisIndex: 1,
data: yData[1].value,
smooth: true,
symbol: 'circle',
showSymbol: false,
symbolSize: 5,
itemStyle: {
color: yData[1].color,
shadowColor: 'rgba(255, 255, 255, .5)',
shadowBlur: 10
},
lineStyle: {
color: yData[1].color,
shadowColor: '#fff',
shadowBlur: 10
}
}
]
}
},
enterHandler (item) {
if (!this.chart) return
this.chart.dispatchAction({
type: 'highlight',
seriesName: item.name
})
},
leaveHandler (item) {
if (!this.chart) return
this.chart.dispatchAction({
type: 'downplay',
seriesName: item.name
})
},
clickHandler (item) {
if (!this.chart) return
item.selected = !item.selected
this.chart.dispatchAction({
type: 'legendToggleSelect',
name: item.name
})
}
}
}
</script>


 2326
2326


 被折叠的 条评论
为什么被折叠?
被折叠的 条评论
为什么被折叠?
 到【灌水乐园】发言


