归一化
进行归一化和标准化的原因:
由于所建立模型的输入数据范围可能非常大,且各种数据的量纲不一致,这样的数据很容易对训练得到的模型结果产生很大影响,因此需要对其进行标准化处理,去除数据单位限制,将其转化为无量纲的纯数值,方便不同单位或量级的数据指标直接进行比较和加权。
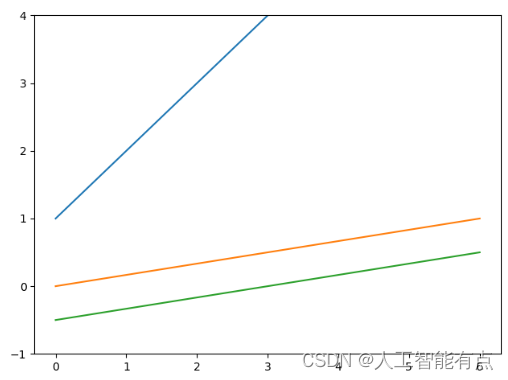
第一个例子
简而言之,归一化的目的就是使得预处理的数据被限定在一定的范围内(比如[0,1]或者[-1,1]),从而消除奇异样本数据导致的不良影响。[https://zhuanlan.zhihu.com/p/424518359]
对比效果
import numpy as np
import matplotlib.pyplot as plt
# 归一化的两种方式
def normalization1(x):
    '''归一化(0~1)'''
    '''x_=(x−x_min)/(x_max−x_min)'''
    return [(float(i) - min(x)) / float(max(x) - min(x)) for i in x]
def normalization2(x):
    '''归一化(-1~1)'''
    '''x_=(x−x_mean)/(x_max−x_min)'''
    return [(float(i) - np.mean(x)) / (max(x) - min(x)) for i in x]
test_list = [1,2,3,4,5,6,7]
normal_1 = normalization1(test_list)
normal_2 = normalization2(test_list)

plt.ylim(-1, 4)
plt.plot(test_list)
plt.plot(normal_1)
plt.plot(normal_2)
plt.show()

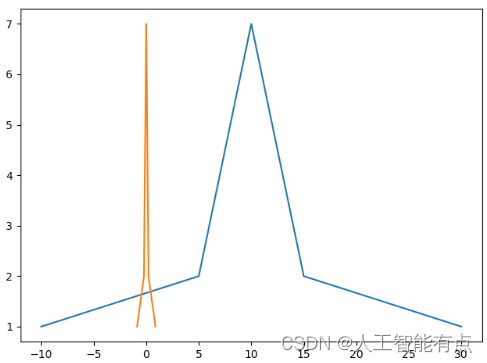
第二个例子
import numpy as np
import matplotlib.pyplot as plt

#归一化的两种方式
def Normalization1(x):
    '''归一化(0~1)'''
    '''x_=(x−x_min)/(x_max−x_min)'''
    return [(float(i)-min(x))/float(max(x)-min(x)) for i in x]
def Normalization2(x):
    '''归一化(-1~1)'''
    '''x_=(x−x_mean)/(x_max−x_min)'''
    return [(float(i)-np.mean(x))/(max(x)-min(x)) for i in x]

#标准化
def z_score(x):
    '''x∗=(x−μ)/σ'''
    x_mean=np.mean(x)
    s2=sum([(i-np.mean(x))*(i-np.mean(x)) for i in x])/len(x)
    return [(i-x_mean)/s2 for i in x]

l=[-10, 5, 5, 6, 6, 6, 7, 7, 7, 7, 8, 8, 8, 8, 8, 9, 9, 9, 9,
 9, 9, 10, 10, 10, 10, 10, 10, 10, 11, 11, 11, 11,11, 11, 12,
12, 12, 12, 12, 13, 13, 13, 13, 14, 14, 14, 15, 15, 30]

cs=[]
for i in l:
    c=l.count(i)
    cs.append(c)
print(cs)
n1 = Normalization1(l)
n2 = Normalization2(l)
z = z_score(l)
print('n1:\t', n1)
print('n2:\t', n2)
print('z:\t', z)
'''
蓝线为原始数据,橙线为z
'''
plt.plot(l,cs)
plt.plot(z,cs)
plt.show()
[1, 2, 2, 3, 3, 3, 4, 4, 4, 4, 5, 5, 5, 5, 5, 6, 6, 6, 6, 6, 6, 7, 7, 7, 7, 7, 7, 7, 6, 6, 6, 6, 6, 6, 5, 5, 5, 5, 5, 4, 4, 4, 4, 3, 3, 3, 2, 2, 1]
n1:	 [0.0, 0.375, 0.375, 0.4, 0.4, 0.4, 0.425, 0.425, 0.425, 0.425, 0.45, 0.45, 0.45, 0.45, 0.45, 0.475, 0.475, 0.475, 0.475, 0.475, 0.475, 0.5, 0.5, 0.5, 0.5, 0.5, 0.5, 0.5, 0.525, 0.525, 0.525, 0.525, 0.525, 0.525, 0.55, 0.55, 0.55, 0.55, 0.55, 0.575, 0.575, 0.575, 0.575, 0.6, 0.6, 0.6, 0.625, 0.625, 1.0]
n2:	 [-0.5, -0.125, -0.125, -0.1, -0.1, -0.1, -0.075, -0.075, -0.075, -0.075, -0.05, -0.05, -0.05, -0.05, -0.05, -0.025, -0.025, -0.025, -0.025, -0.025, -0.025, 0.0, 0.0, 0.0, 0.0, 0.0, 0.0, 0.0, 0.025, 0.025, 0.025, 0.025, 0.025, 0.025, 0.05, 0.05, 0.05, 0.05, 0.05, 0.075, 0.075, 0.075, 0.075, 0.1, 0.1, 0.1, 0.125, 0.125, 0.5]
z:	 [-0.875, -0.21875, -0.21875, -0.175, -0.175, -0.175, -0.13125, -0.13125, -0.13125, -0.13125, -0.0875, -0.0875, -0.0875, -0.0875, -0.0875, -0.04375, -0.04375, -0.04375, -0.04375, -0.04375, -0.04375, 0.0, 0.0, 0.0, 0.0, 0.0, 0.0, 0.0, 0.04375, 0.04375, 0.04375, 0.04375, 0.04375, 0.04375, 0.0875, 0.0875, 0.0875, 0.0875, 0.0875, 0.13125, 0.13125, 0.13125, 0.13125, 0.175, 0.175, 0.175, 0.21875, 0.21875, 0.875]

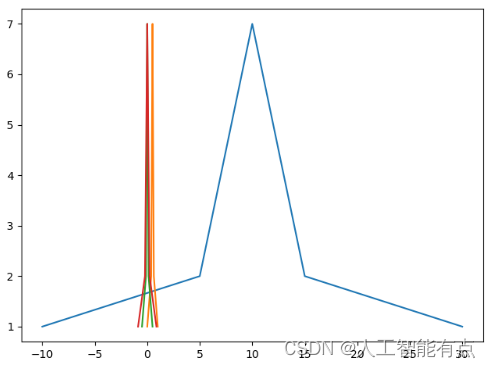
plt.plot(l, cs)
plt.plot(n1, cs)
plt.plot(n2, cs)
plt.plot(z, cs)
plt.show()


 被折叠的 条评论
为什么被折叠?


