


 该文章详细解析了在React应用中使用Echarts-for-react库创建雷达图的常见基础配置,包括数据处理、颜色设定、图例样式、雷达图指标和区域填充等。示例代码展示了如何构建具有渐变色效果的雷达图组件。
详细配置项可跳转至我的文章 ReactEcharts常见基础配置项解析
代码实现
import React from 'react';
import ReactEcharts from 'echarts-for-react';

export default function BarEcharts(props) {
    const { dataList = [] } = props;
    const nameList = props.nameList?.map(item => {
        return {
            ...item,
            name: item,
            max: 500,
        };
    });
    const legendData = ['2023-04', '2023-03'];

    let dataArr = [
        {
            value: dataList,
            name: legendData?.[0],
            itemStyle: {
                normal: {
                    lineStyle: {
                        color: '#5B8FF9',
                        shadowColor: '#5B8FF9',
                        shadowBlur: 10,
                    },
                    opacity: 0,
                },
            },
            areaStyle: {
                normal: {
                    // 单项区域填充样式
                    color: {
                        type: 'linear',
                        x: 0, //右
                        y: 0, //下
                        x2: 1, //左
                        y2: 1, //上
                        colorStops: [
                            {
                                offset: 0,
                                color: '#5B8FF9',
                            },
                            {
                                offset: 0.5,
                                color: 'rgba(0,0,0,0)',
                            },
                            {
                                offset: 1,
                                color: '#5B8FF9',
                            },
                        ],
                        globalCoord: false,
                    },
                    opacity: 1, // 区域透明度
                },
            },
        },
        {
            value: [350, 150, 250, 450],
            name: legendData?.[1],
            itemStyle: {
                normal: {
                    lineStyle: {
                        color: '#5AD8A6',
                        shadowColor: '#5AD8A6',
                        shadowBlur: 10,
                    },
                    opacity: 0,
                },
            },
            areaStyle: {
                normal: {
                    // 单项区域填充样式
                    color: {
                        type: 'linear',
                        x: 0, //右
                        y: 0, //下
                        x2: 1, //左
                        y2: 1, //上
                        colorStops: [
                            {
                                offset: 0,
                                color: '#5AD8A6',
                            },
                            {
                                offset: 0.5,
                                color: 'rgba(0,0,0,0)',
                            },
                            {
                                offset: 1,
                                color: '#5AD8A6',
                            },
                        ],
                        globalCoord: false,
                    },
                    opacity: 1, // 区域透明度
                },
            },
        },
    ];
    let colorArr = ['#5B8FF9', '#5AD8A6']; //颜色
    let option = {
        background:
            'linear-gradient(270deg, rgba(0,0,0,0) 0%, rgba(3,7,22,0.73) 47%, #061135 100%);',
        color: colorArr,
        tooltip: {
            trigger: 'item',
            confine: true, // tooltip始终显示在grid区域内
        },
        legend: {
            orient: 'horizontal',
            icon: 'roundRect', //图例形状
            data: legendData,
            bottom: 0,
            right: 'center',
            itemWidth: 12, // 图例标记的图形宽度。[ default: 25 ]
            itemHeight: 12, // 图例标记的图形高度。[ default: 14 ]
            itemGap: 35, // 图例每项之间的间隔。[ default: 10 ]横向布局时为水平间隔,纵向布局时为纵向间隔。
            textStyle: {
                fontSize: 14,
                color: '#fff',
            },
        },
        radar: {
            center: ['50%', '50%'],
            radius: '70%', // 配置整体显示比例
            name: {
                show: true,
                width: 10,
                textStyle: {
                    color: '#fff',
                    fontSize: 16,
                    width: 10,
                    overflow: 'truncate',
                },
                formatter: (value, indicator) => {
                    return `${value}`;
                },
            },
            indicator: nameList,
            splitArea: {
                // 坐标轴在 grid 区域中的分隔区域,默认不显示。
                show: true,
                areaStyle: {
                    // 分隔区域的样式设置。
                    color: ['rgba(255,255,255,0)', 'rgba(255,255,255,0)'], // 分隔区域颜色。分隔区域会按数组中颜色的顺序依次循环设置颜色。默认是一个深浅的间隔色。
                },
            },
            axisLine: {
                //指向外圈文本的分隔线样式
                lineStyle: {
                    color: 'rgba(233,233,233,0.3)',
                },
            },
            splitLine: {
                lineStyle: {
                    color: 'rgba(233,233,233,0.3)', // 分隔线颜色
                    width: 1, // 分隔线线宽
                },
            },
        },
        series: [
            {
                type: 'radar',
                symbolSize: 8,
                data: dataArr,
            },
        ],
    };
    return (
        <ReactEcharts
            option={option}
            notMerge
            lazyUpdate
            style={{ height: '400px', width: '400px' }}
        />
    );
}
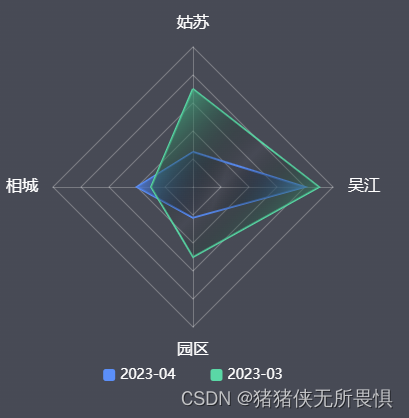
效果图


 390
390

 被折叠的 条评论
为什么被折叠?
被折叠的 条评论
为什么被折叠?
 到【灌水乐园】发言


