


一、效果预览
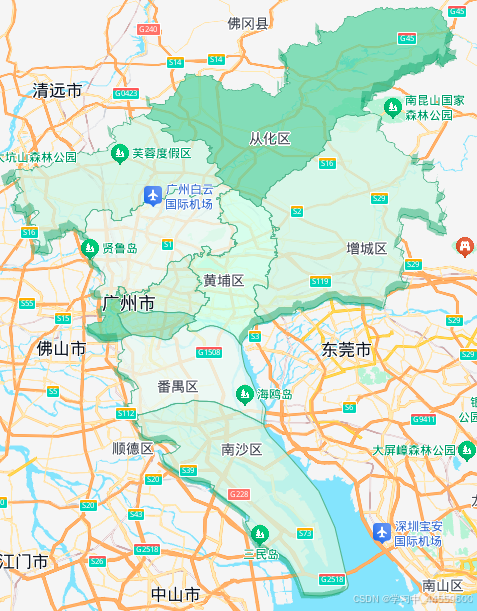
二、核心实现步骤
1. 基础地图初始化
createMap() {
    // 创建地图实例
    this.map = new BMapGL.Map('container');

    // 设置广州中心点坐标
    const center = new BMapGL.Point(113.571429, 23.235336);
    this.map.centerAndZoom(center, 10);

    // 视觉配置
    this.map.enableScrollWheelZoom(true);  // 启用滚轮缩放
    this.map.setTilt(45);  // 关键!设置45度倾斜视角

    // 添加比例尺控件
    const scaleCtrl = new BMapGL.ScaleControl();
    this.map.addControl(scaleCtrl);

    // 加载行政区划层
    this.setMapDist(this.map);
}
2. 行政区划
const setMapDist = (map) => {
    // 颜色映射规则:天河区-蓝色,越秀区-绿色...
    const colorRules = [
        'case',
        ['boolean', ['feature-state', 'picked'], false],
        '#d9edff',  // 选中态颜色
        ['match', ['get', 'name'],
            '天河区', '#2467f2',
            '越秀区', '#24f2a3',
            '#d9edff' // 默认色
        ]
    ];

    // 创建填充层
    const fillLayer = new BMapGL.FillLayer({
        crs: 'GCJ02', // 必须!使用国测局坐标
        style: {
            fillColor: colorRules,
            fillOpacity: 0.75, // 区域透明度
            strokeWeight: 1,   // 边界线粗
            strokeColor: '#88a0c6' // 边界色
        }
    });

    // 加载GeoJSON数据
    fillLayer.setData(guangzhouGeoJSON);
    map.addNormalLayer(fillLayer);
}
效果图: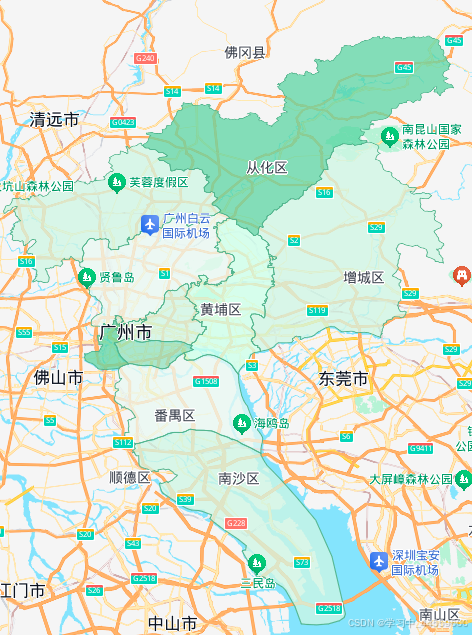
3. 棱柱(实现3D效果)
这里的重点是数据guangzhouPrism,如果使用new BMapGL.Boundary()返回的数据,卡卡卡
// 遍历棱柱数据
guangzhouPrism.forEach(points => {
    // 转换坐标点
    const path = points.map(p =>
        new BMapGL.Point(p[0], p[1])
    );

    // 创建棱柱(高度5000米)
    const prism = new BMapGL.Prism(path, 5000, {
        topFillColor: '#d9edff',    // 顶部颜色
        topFillOpacity: 0.5,        // 顶部透明度
        sideFillColor: '#5679ea',   // 侧面颜色
        sideFillOpacity: 0.8        // 侧面透明度
    });

    prism.setZIndex(10); // 确保在填充层之上
    map.addOverlay(prism);
});棱柱数据格图百度地图式说明:
const guangzhouPrism = [
[ // 单个建筑轮廓
[113.332,23.132],
[113.335,23.135],
[113.338,23.130]
],
// ...更多数据
];


 4043
4043

 被折叠的 条评论
为什么被折叠?
被折叠的 条评论
为什么被折叠?
 到【灌水乐园】发言


