


import matplotlib.pyplot as plt
import matplotlib
matplotlib.use('TkAgg')
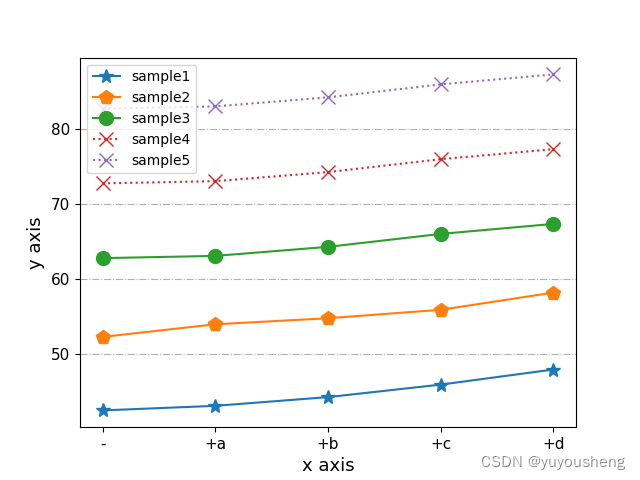
y1 = [42.42, 43.03, 44.20, 45.87, 47.89]
y2 = [52.25, 53.94, 54.75, 55.88, 58.18]
y3 = [62.79, 63.09, 64.30, 66.03, 67.37]
y4 = [72.79, 73.09, 74.30, 76.03, 77.37]
y5 = [82.79, 83.09, 84.30, 86.03, 87.37]
fig, ax = plt.subplots(figsize=(6.4, 4.8), dpi=100)
x = ["Base", "+a", "+b", "+c", "+d"]
ax.plot(x, y1, label='sample1', linestyle='-', marker='*', markersize='10')
ax.plot(x, y2, label='sample2', linestyle='-', marker='p', markersize='10')
ax.plot(x, y3, label='sample3', linestyle='-', marker='o', markersize='10')
ax.plot(x, y4, label='sample4', linestyle=':', marker='x', markersize='10')
ax.plot(x, y5, label='sample5', linestyle=':', marker='x', markersize='10')
ax.set_xlabel('x axis', fontsize=13)
ax.set_ylabel('y axis', fontsize=13)
ax.tick_params(axis='both', labelsize=11)
ax.yaxis.grid(True, linestyle='-.')
legend = ax.legend(loc='best')
plt.show()
# 保存为png
fig.savefig('./pic.png')
# 保存为pdf
fig.savefig('./pic.pdf', format='pdf')
生成的图如下所示:


 被折叠的 条评论
为什么被折叠?
被折叠的 条评论
为什么被折叠?
 到【灌水乐园】发言


