前言:
echarts实现3d饼图
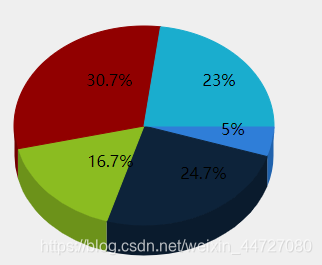
效果图:
<script src="https://d3js.org/d3.v6.min.js"></script>
实现源码:
var salesData = [{
    label: "Basic",
    color: "#2f7ed8"
}, {
    label: "Plus",
    color: "#0d233a"
}, {
    label: "Lite",
    color: "#8bbc21"
}, {
    label: "Elite",
    color: "#910000"
}, {
    label: "Delux",
    color: "#1aadce"
}];
var width = 400,
    height = 500;
var svg = d3.select("#chart-panel").append("svg")
    .attr("width", width)
    .attr("height", height)
    .append("g").attr("id", "circleDonut");
Donut3D.draw("circleDonut", randomData(), 150, 150, 130, 100, 30, 0);

function randomData() {
    return salesData.map(function(d) {
        return {
            label: d.label,
            value: 1000 * Math.random(),
            color: d.color
        };
    });
}
$('#chart-panel div').css('display', 'none');


 1万+
1万+


 被折叠的 条评论
为什么被折叠?
被折叠的 条评论
为什么被折叠?
 到【灌水乐园】发言


