


Echarts 实践
一、demos试水
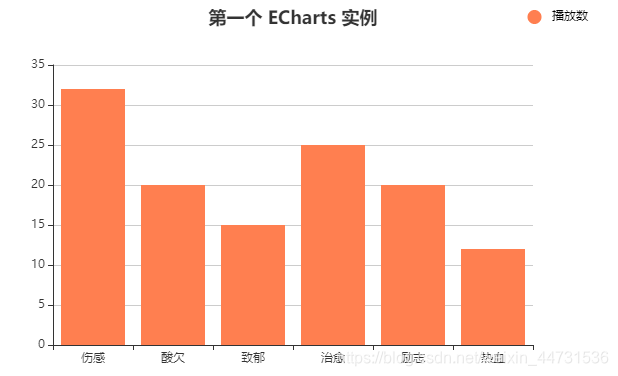
1.仿官网demo —— 柱状图
<!DOCTYPE html>
<html lang="en">
<head>
  <meta charset="UTF-8">
  <meta name="viewport" content="width=device-width, initial-scale=1.0">
  <title>My First ECharts</title>
  <script src="js/echarts47.min.js"></script>
</head>
<body>
  <!-- 给图表准备一个具有宽高的容器(Dom) -->
  <div id="mainBox" style="width: 600px;height:400px;"></div>

  <!-- 编写相关js,配置echarts -->
  <script type="text/javascript">
    // 绑定dom;初始化echarts示例...
    var myChart = echarts.init(document.getElementById('mainBox'));

    // 指定图表的配置项和数据
    var option = {
      // 全图默认背景
      backgroundColor: 'rgba(0,0,0,0)',
      // 默认色板
      color: ['#ff7f50','#87cefa','#da70d6','#32cd32','#6495ed',
              '#ff69b4','#ba55d3','#cd5c5c','#ffa500','#40e0d0',
              '#1e90ff','#ff6347','#7b68ee','#00fa9a','#ffd700',
              '#6699FF','#ff6666','#3cb371','#b8860b','#30e0e0'],

      // 配置标题
      title: {
        x: 'center',
        y: 'top',
        text: '第一个 ECharts 实例',
        textStyle: {
            fontSize: 18,
            fontWeight: 'bolder',
            color: '#333'          // 主标题文字颜色
        },
      },
      // 配置提示信息
      tooltip: {
        show: true
      },
      // 图例组件展现了不同系列的标记(symbol),颜色和名字。可以通过点击图例控制哪些系列不显示。
      legend: {
        orient: 'horizontal',     // 布局方式,默认为水平布局,可选为:'horizontal' ¦ 'vertical'
        x: 'right',               // 水平安放位置,默认为全图居中,可选为:
                                  // 'center' ¦ 'left' ¦ 'right'
                                  // ¦ {number}(x坐标,单位px)
        y: 'top',                 // 垂直安放位置,默认为全图顶端,可选为:
                                  // 'top' ¦ 'bottom' ¦ 'center'
                                  // ¦ {number}(y坐标,单位px)
        data: [{
          name: '播放数',
          // 强制设置图形为圆
          icon: 'circle',
          // 设置文本颜色-黑色
          textStyle: {
            color: '#000'
          }
        }],

      },
      xAxis: {
        data: ['伤感','酸欠','致郁','治愈','励志','热血']
      },
      yAxis: {},
      series: [{
        name: '播放数', //系列名称
        type: 'bar', //系列图表类型
        data: [32,20,15,25,20,12] //数据内容
      }]
    };

    // 使用以上配置和数据显示图表
    myChart.setOption(option);
  </script>
</body>
</html>
- 展示效果:
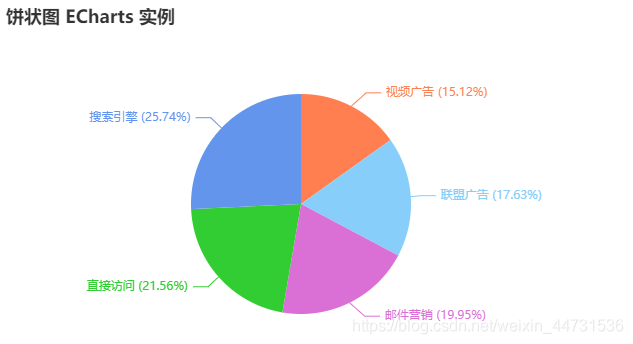
2.饼状图demo
<!DOCTYPE html>
<html lang="en">
<head>
  <meta charset="UTF-8">
  <meta name="viewport" content="width=device-width, initial-scale=1.0">
  <title>饼状图demo</title>
  <script src="../js/echarts47.min.js"></script>
</head>
<body>
  <div id="mainBox" style="width: 600px;height: 400px;"></div>
  <script type="text/javascript">
    var myEcharts = echarts.init(document.getElementById('mainBox'));

    var pieOption = {
      // 全图默认背景
      // backgroundColor: 'rgba(0,0,0,0)',
      // 默认色板
      color: ['#ff7f50','#87cefa','#da70d6','#32cd32','#6495ed',
              '#ff69b4','#ba55d3','#cd5c5c','#ffa500','#40e0d0',
              '#1e90ff','#ff6347','#7b68ee','#00fa9a','#ffd700',
              '#6699FF','#ff6666','#3cb371','#b8860b','#30e0e0'],

      // 配置标题
      title: {
        x: 'left',
        y: 'top',
        text: '饼状图 ECharts 实例',
        textStyle: {
            fontSize: 18,
            fontWeight: 'bolder',
            color: '#333'          // 主标题文字颜色
        },
      },

      // 数据
      series : {
        name: '访问来源',
        type: 'pie',
        radius: '55%',  // 饼图的半径,外半径为可视区尺寸(容器高宽中较小一项)的 55% 长度。
        // roseType: 'angle',  // 把饼图显示成南丁格尔图
        data:[
          {value:235, name:'视频广告'},
          {value:274, name:'联盟广告'},
          {value:310, name:'邮件营销'},
          {value:335, name:'直接访问'},
          {value:400, name:'搜索引擎'}
        ],
        itemStyle: {
          // 阴影的配置
          emphasis: {
              shadowBlur: 10,
              shadowOffsetX: 0,
              shadowColor: 'rgba(0, 0, 0, 0.5)'
          },
          // 条目展示数据样式
          normal:{
              label: {
                  show: true,
                  formatter: '{b} ({d}%)' //显示百分比
              },
              labelLine: {show:true}
          }
        }
      },

      // 配置提示信息
      tooltip: {
        trigger: "item",
        formatter: "{b}产值<br>{c}"
        // show: true
      }
    }

    myEcharts.setOption(pieOption);
  </script>
</body>
</html>
- 展示效果


 被折叠的 条评论
为什么被折叠?
被折叠的 条评论
为什么被折叠?
 到【灌水乐园】发言


