


import pandas as pd
import os
xlsx_path = "./datas/stocks/baidu_stocks.xlsx"
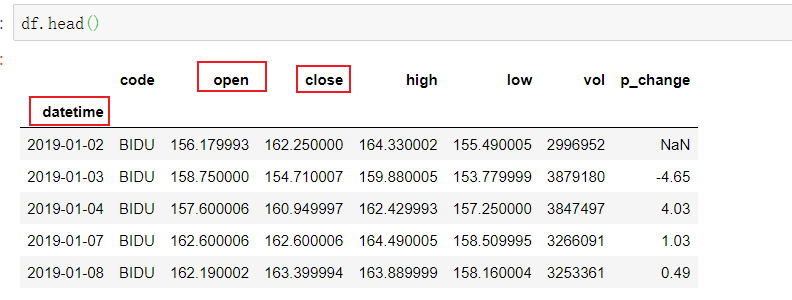
df = pd.read_excel(xlsx_path,index_col='datetime',parse_dates=True)
df.head()
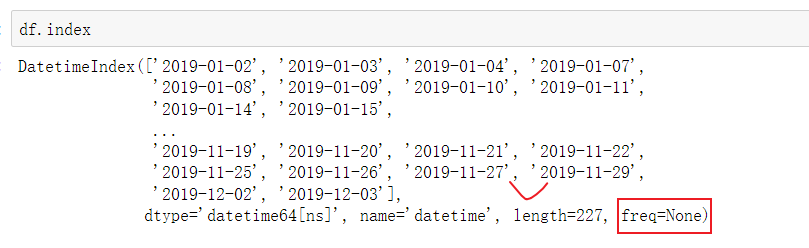
df.sort_index(inplace=True)
df.index
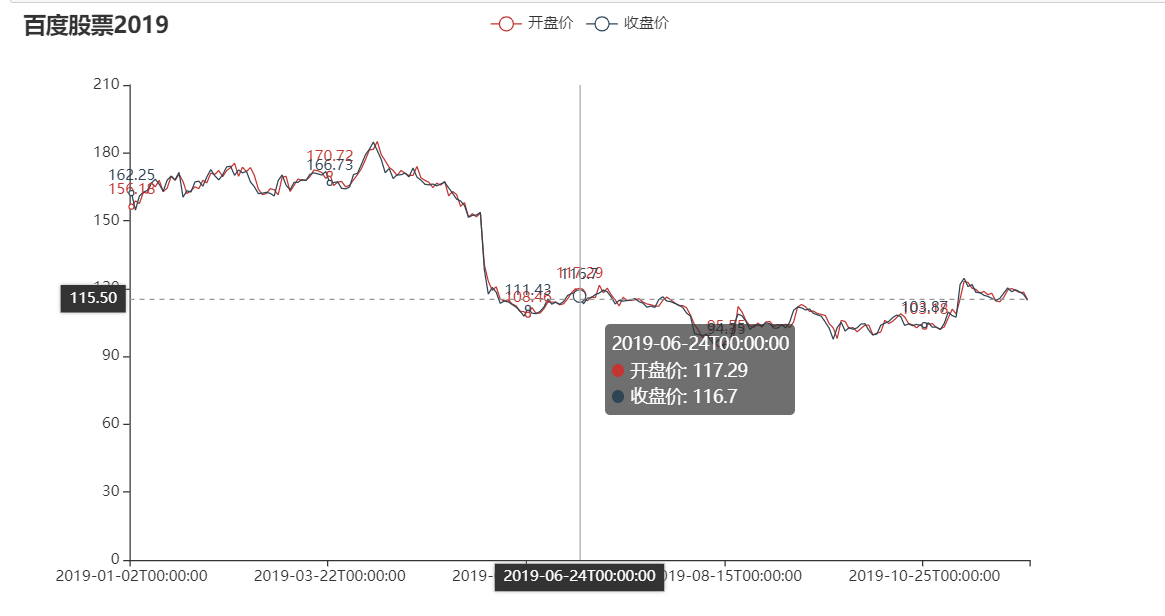
# 使用Pyecharts绘制折线图
# !pip install pyecharts==v1.7.1
# 导入绘图模块
from pyecharts.charts import Line
from pyecharts import options as opts
# 折现图:
line = Line()
# X轴
line.add_xaxis(df.index.tolist())
# Y轴
line.add_yaxis('开盘价',df['open'].round(2).tolist())
line.add_yaxis('收盘价',df['close'].round(2).tolist())
# 图表配置
line.set_global_opts(
title_opts = opts.TitleOpts(title = '百度股票2019'),
tooltip_opts = opts.TooltipOpts(trigger = 'axis',axis_pointer_type = 'cross')
)
# 渲染数据,在jupyternote 直接生成
line.render_notebook()
# 渲染数据,生成html存入到工作目录
line.render('BIDU_LINE.html') # 括号中为命名


 6910
6910


 被折叠的 条评论
为什么被折叠?
被折叠的 条评论
为什么被折叠?
 到【灌水乐园】发言


