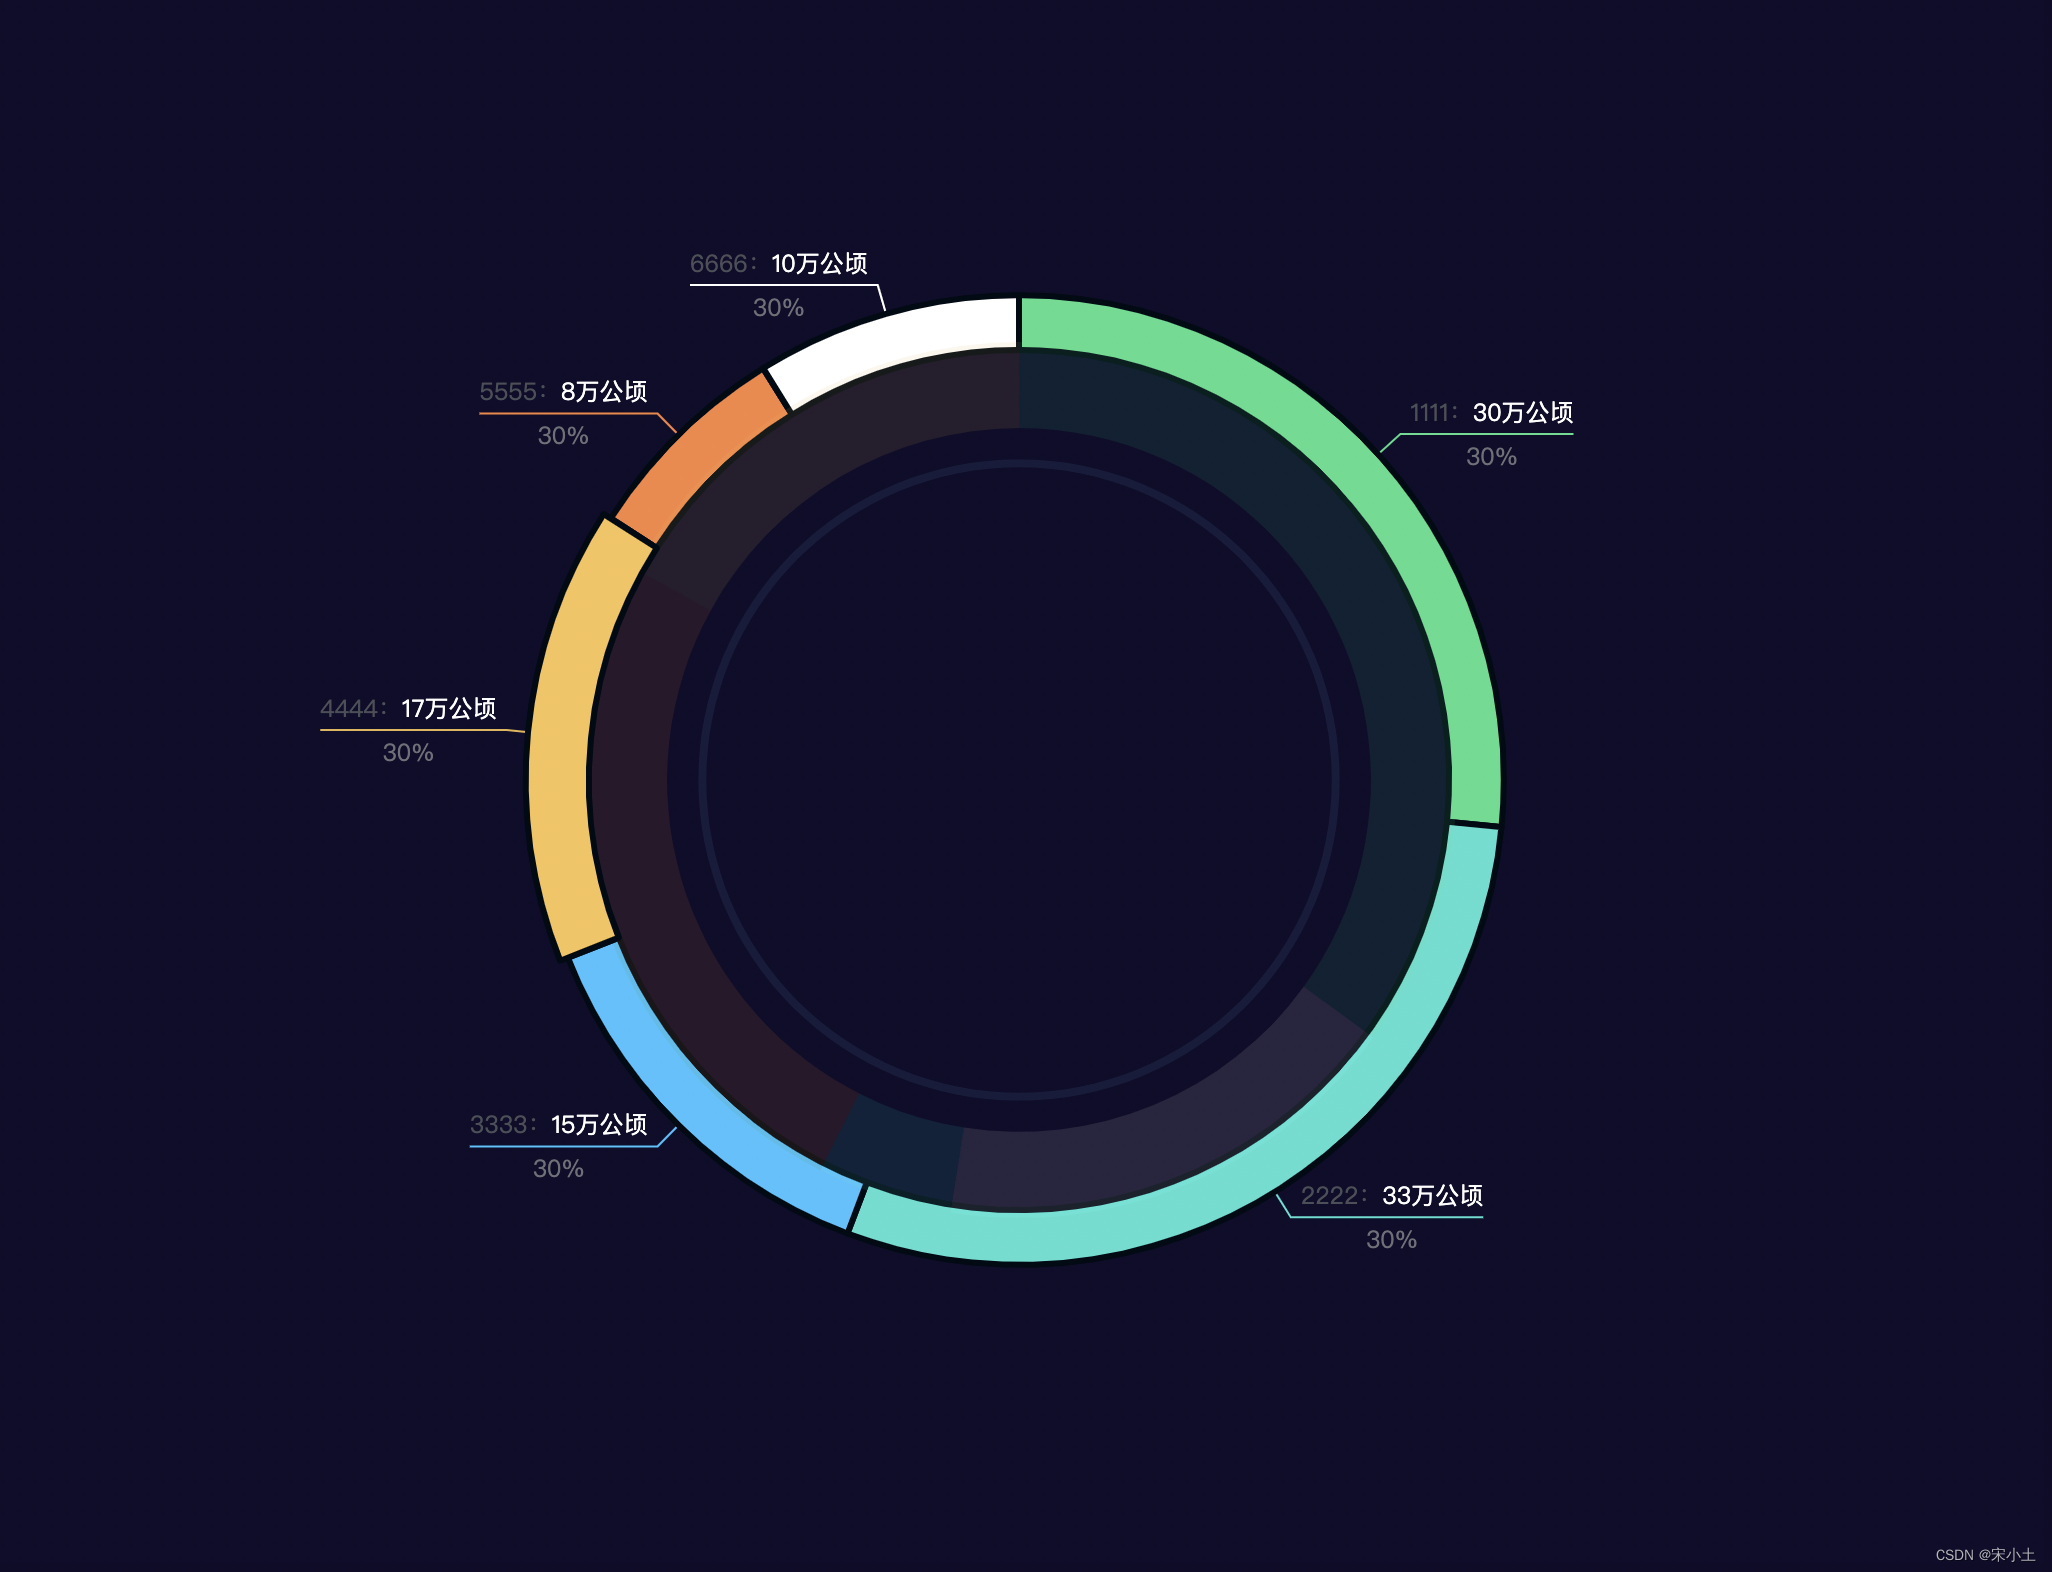
Echarts 环形图demo

项目场景:

Echarts 环形图demo

问题描述

在这里插入图片描述

@Override
 option = {
        grid: {
          //grid 组件离容器上下左右侧的距离
          left: "0%",
          right: "0%",
          top: "-10%",
          bottom: "0%",
          containLabel: true,
        },
        series: [
          {
            // 第一环
            type: "pie",
            zlevel: 1,
            silent: true,
            radius: ["40%", "41%"],
            hoverAnimation: false,
            color: "rgba(88,142,197,0.1)",
            // animation:false,    //charts3 no
            label: {
              normal: {
                show: false,
              },
            },
            labelLine: {
              normal: {
                show: false,
              },
            },
            data: [1],
          },
          {
            name: "30%",
            type: "pie",
            radius: ["55%", "62%"],
            labelLine: {
              length: 15,
              length2: 0,
              maxSurfaceAngle: 80,
            },
            itemStyle: {
              // 此配置
              normal: {
                borderWidth: 3,
                borderColor: "#000914",
              },
            },
            label: {
              // position: "inside",
              textStyle: {
                color: "#FFF",
              },
              formatter: "{b|{b}:}{c}万公顷{abg|}\n{a|{a}}",
              borderRadius: 4,
              rich: {
                a: {
                  color: "#6E7079",
                  lineHeight: 22,
                  align: "center",
                },
                hr: {
                  borderColor: "#8C8D8E",
                  width: "100%",
                  borderWidth: 2,
                  // height: 0,
                },
                b: {
                  color: "#4C5058",
                  lineHeight: 22,
                },
                c: {
                  color: "rgba(255, 255, 255, 0.65)",
                  fontSize: 14,
                  fontWeight: "bold",
                },
                per: {
                  color: "#fff",
                  backgroundColor: "#4C5058",
                  padding: [3, 4],
                  borderRadius: 4,
                },
              },
            },
            labelLayout: function (params) {
              const isLeft = params.labelRect.x < myChart.getWidth() / 2;
              const points = params.labelLinePoints;
              // Update the end point.
              points[2][0] = isLeft
                ? params.labelRect.x
                : params.labelRect.x + params.labelRect.width;
              return {
                labelLinePoints: points,
              };
            },
            data: [
              {
                value: 30,
                name: "1111",
                itemStyle: { normal: { color: "#0DDE8C" } },
              },
              {
                value: 33,
                name: "2222",
                itemStyle: { normal: { color: "#04E0D0" } },
              },
              {
                value: 15,
                name: "3333",
                itemStyle: { normal: { color: "#1CC2FF" } },
              },
              {
                value: 17,
                name: "4444",
                itemStyle: { normal: { color: "#E4B550" } },
              },
              {
                value: 8,
                name: "5555",
                itemStyle: { normal: { color: "#FE8641" } },
              },
              {
                value: 10,
                name: "6666",
                itemStyle: { normal: { color: "#FFFFFF" } },
              },
            ],
          },
          {
            name: "30%",
            type: "pie",
            radius: ["45%", "56%"],
            hoverAnimation: false,
            label: {
              show: false,
            },
            data: [
              {
                value: 70,
                name: "1111",
                itemStyle: { normal: { color: "#0DDE8C", opacity: "0.1" } },
              },
              {
                value: 35,
                name: "2222",
                itemStyle: { normal: { color: "#FDFDFD", opacity: "0.1" } },
              },
              {
                value: 10,
                name: "3333",
                itemStyle: { normal: { color: "#04DFCF", opacity: "0.1" } },
              },
              {
                value: 51,
                name: "4444",
                itemStyle: { normal: { color: "#FC8541", opacity: "0.1" } },
              },
              {
                value: 34,
                name: "5555",
                itemStyle: { normal: { color: "#E3B450", opacity: "0.1" } },
              },
            ],
          },
        ],
      };

  • 0
    点赞
  • 2
    收藏
    觉得还不错? 一键收藏
  • 0
    评论

“相关推荐”对你有帮助么?

  • 非常没帮助
  • 没帮助
  • 一般
  • 有帮助
  • 非常有帮助
提交
评论
添加红包

请填写红包祝福语或标题

红包个数最小为10个

红包金额最低5元

当前余额3.43前往充值 >
需支付:10.00
成就一亿技术人!
领取后你会自动成为博主和红包主的粉丝 规则
hope_wisdom
发出的红包
实付
使用余额支付
点击重新获取
扫码支付
钱包余额 0

抵扣说明:

1.余额是钱包充值的虚拟货币,按照1:1的比例进行支付金额的抵扣。
2.余额无法直接购买下载,可以购买VIP、付费专栏及课程。

余额充值