


server
https://github.com/prometheus/prometheus/releases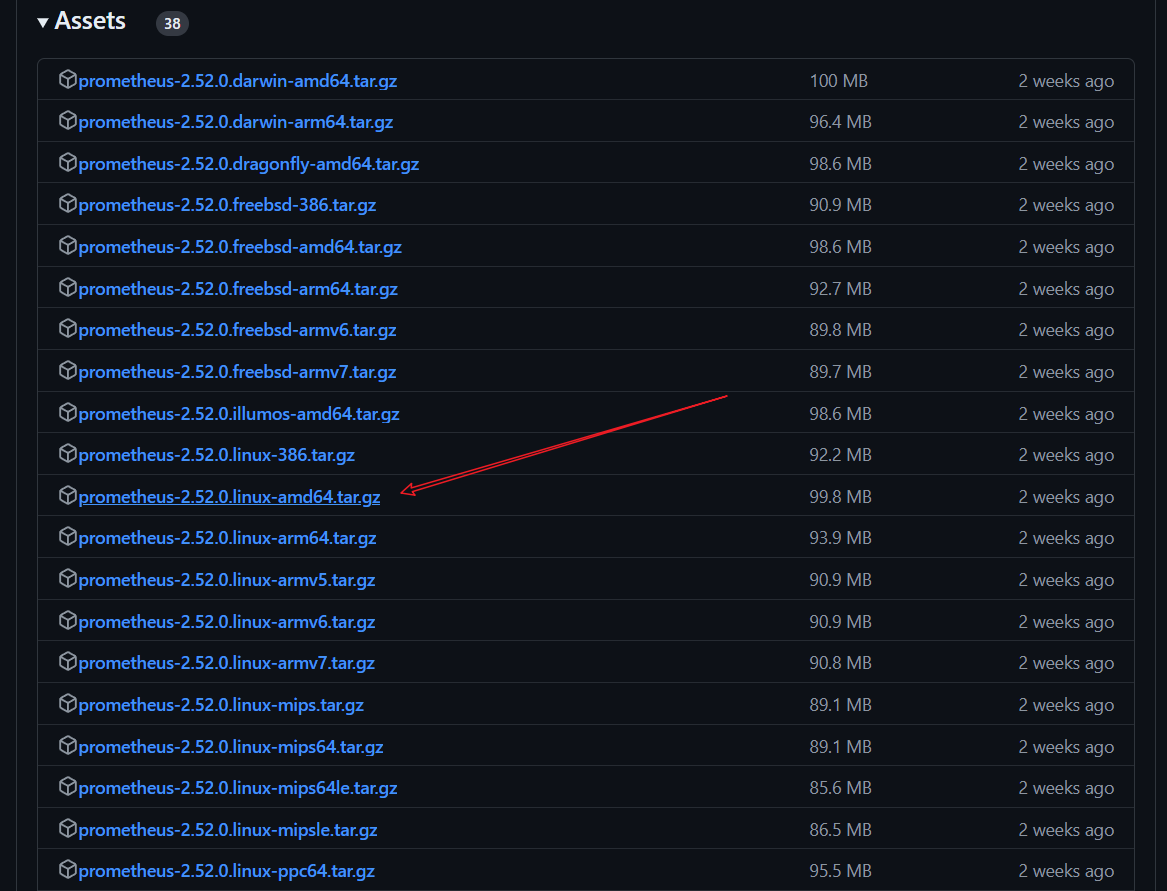
1.打开 SELinux 的配置文件
vi /etc/selinux/config
SELINUX=permissive
2.解压到/usr/local/,再重命名
tar -xzvf prometheus-2.52.0.linux-amd64.tar.gz -C /usr/local/
cd /usr/local
mv prometheus-2.52.0.linux-amd64/ prometheus/
3.查看版本
cd /usr/local/prometheus
./prometheus --version
检查 prometheus.yml 格式的命令(一定要在/usr/local/prometheus 目录下执行)
/usr/local/prometheus/promtool check config prometheus.yml
4.创建 prometheus 本地 TSDB 数据存储目录
mkdir -p /var/lib/prometheus
5.使用systemctl 管理 Prometheus
vi /usr/lib/systemd/system/prometheus.service
[Unit]
Description=Prometheus
Documentation=https://prometheus.io/
After=network.target

[Service]
Type=simple
User=root
ExecStart=/usr/local/prometheus/prometheus --config.file=/usr/local/prometheus/prometheus.yml --storage.tsdb.path=/var/lib/prometheus --web.enable-lifecycle
ExecReload=/bin/kill -HUP $MAINPID
KillMode=process
Restart=on-failure

[Install]
WantedBy=multi-user.target
6.设置 Prometheus 开机启动
systemctl enable prometheus
systemctl start prometheus
systemctl status prometheus
7. ip:9090
#####################################################################################
node-exporter
https://github.com/prometheus/node_exporter/releases/tag/v1.7.0
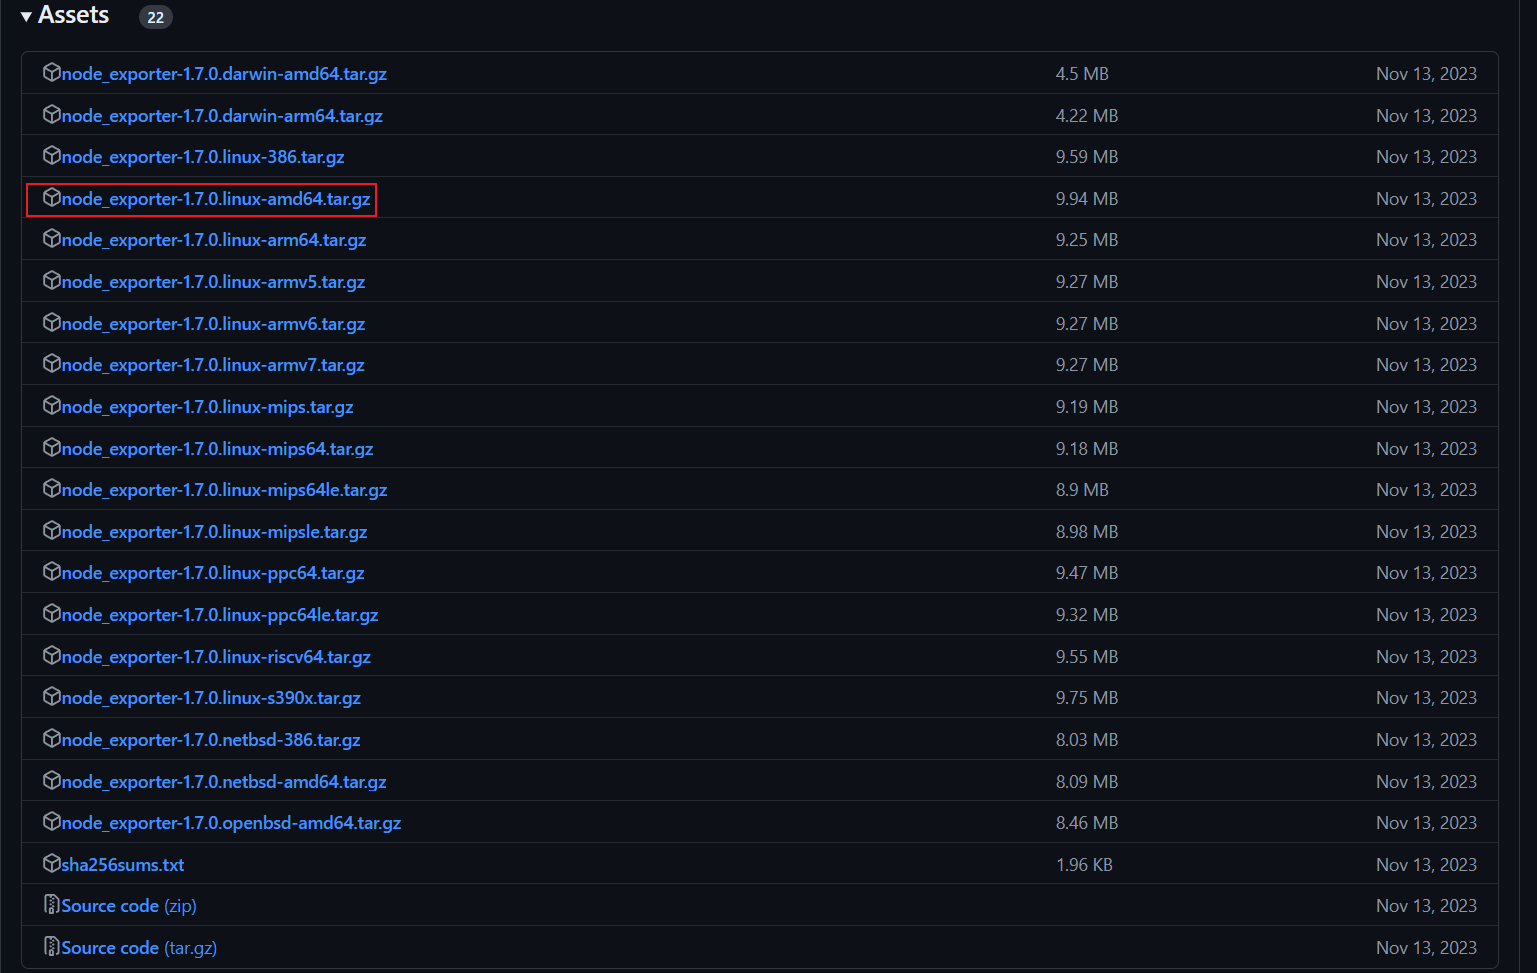
1.解压到/usr/local/,再重命名
tar -xzvf node_exporter-1.7.0.linux-amd64.tar.gz -C /usr/local/
cd /usr/local
mv node_exporter-1.7.0.linux-amd64/ node_exporter/
2.systemctl 管理 node_exporter
vi /usr/lib/systemd/system/node_exporter.service
[Unit]
Description=node_exporter
Documentation=https://prometheus.io/
After=network.target

[Service]
Type=simple
User=root
ExecStart=/usr/local/node_exporter/node_exporter
ExecReload=/bin/kill -HUP $MAINPID
KillMode=process
Restart=on-failure

[Install]
WantedBy=multi-user.target
3.设置开机启动
systemctl enable node_exporter
systemctl start node_exporter
systemctl status node_exporter
#####################################################################################
1.添加 node 节点监控
在 prometheus Server 配置文件中添加被监控的机器
vi /usr/local/prometheus/prometheus.yml
2.检查prometheus.yml 格式(一定要在 /usr/local/prometheus 目录下执行)
/usr/local/prometheus/promtool check config prometheus.yml
3.热加载
curl -X POST http://127.0.0.1:9090/-/reload
4.在prometheus 主机添加 node 节点监控
#####################################################################################
Grafana
wget https://dl.grafana.com/enterprise/release/grafana-enterprise-9.2.2-1.x86_64.rpm
yum install grafana-enterprise-9.2.2-1.x86_64.rpm
1、启动Grafana 服务
systemctl enable grafana-server
systemctl start grafana-server
systemctl status grafana-server
ip:3000
默认的账号密码是 admin/admin


 850
850


 被折叠的 条评论
为什么被折叠?
被折叠的 条评论
为什么被折叠?
 到【灌水乐园】发言


