<template>
<div>
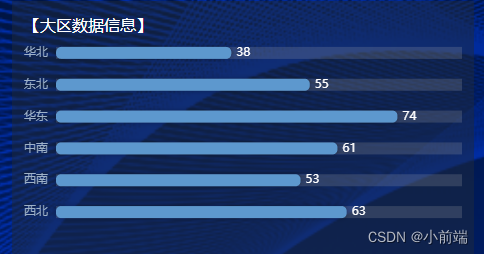
<div>【大区数据信息】</div>
<div ref="target" class="w-full h-full" ></div>
</div>
</template>
<script setup>
import { ref, onMounted, watch} from "vue";
import * as echarts from "echarts";
const regions=[
{
"id": 1,
"name": "华北",
"value": 56
},
{
"id": 2,
"name": "东北",
"value": 50
},
{
"id": 3,
"name": "华东",
"value": 86
},
{
"id": 4,
"name": "中南",
"value": 55
},
{
"id": 5,
"name": "西南",
"value": 52
},
{
"id": 6,
"name": "西北",
"value": 77
}
]
let myChart = null;
const target = ref(null);
onMounted(() => {
myChart = echarts.init(target.value);
renderChart();
});
const renderChart = () => {
const options = {
xAxis: {
show: false,
type: "value",
max: function (value) {
return parseInt(value.max * 1.2);
},
},
yAxis: {
type: "category",
data: regions.map((item) => item.name),
inverse: true,
axisLine: { show: false },
axisTick: { show: false },
axisLabel: { color: "#9eb1c8" },
},
grid: {
top: 0,
right: 0,
bottom: 0,
left: 0,
containLabel: true,
},
series: [
{
type: "bar",
data:regions.map((item) => ({
name: item.name,
value: item.value,
})),
showBackground: true,
backgroundStyle: {
color: "rgba(180, 180, 180, 0.2)",
},
itemStyle: {
color: "#5D98CE",
barBorderRadius: 5,
shadowColor: "rgba(0,0,0,0.3)",
shadowBlur: 5,
},
barWidth: 12,
label: {
show: true,
position: "right",
textStyle: {
color: "#fff",
},
},
},
],
};
myChart.setOption(options);
};
watch(
() => regions,
() => renderChart()
);
</script>
<style lang="scss" scoped></style>


 被折叠的 条评论
为什么被折叠?
被折叠的 条评论
为什么被折叠?
 到【灌水乐园】发言


