


基本参数
-
温度
上升1.5度
-
盐度
海洋中"淡水变淡水,咸水变咸水"的变化模式表明了"湿变湿,干变干"的模式,它描述了全球变暖驱动下水循环的放大。
新鲜的领域正在变得更新鲜;盐渍地区正变得越来越咸
-
热量
The upper 2000 m of the world’s oceans have warmed on average by 5.5 ± 0.3 ZJ yr−1 (1 ZJ = 1021 Joules) during 1958–2022 (IAP/CAS) and by 5.3 ± 0.4 ZJ yr−1 during 1958–2020 (NCEI/NOAA pentad estimate).
-
海平面
Global mean sea level (GMSL) is rising (virtually certain1) and accelerating (high confidence2). The sum of glacier and ice sheet contributions is now the dominant source of GMSL rise (very high confidence).
GMSL from tide gauges and altimetry observations increased from 1.4 mm yr–1 over the period 1901–1990 to 2.1 mm yr–1 over the period 1970–2015 to 3.2 mm yr–1 over the period 1993–2015 to 3.6 mm yr–1 over the period 2006–2015 (high confidence). The dominant cause of GMSL rise since 1970 is anthropogenic forcing
海水层结
海洋层化结构:温度,盐度,压力
稳定层结抑制了垂直混合,影响了热量、碳、溶解氧和营养盐的垂直交换
在过去的半个世纪里,层化有间断的增加,年际变化大(图2b )。这种增加表明,由于温度和盐度的变化,世界海洋的垂直结构变得更加稳定
随着水层变得更加稳定,热量、碳、营养盐和其他浓度的垂直混合预计会减少。
-
层结变化
海洋上层2000 m的层结自1960年以来增加了5.3 %
而在上部150 m处则高达10 % ~ 20 %。
-
垂向热量输送
-
垂向物质交换
环流
-
AMOC
AMOC对于热量输送的重要性
AMOC的敏感性
-
上层海水动能增加
海气作用
在水分不受限制的海洋上空,潮湿的区域变得越来越湿润,而干燥的区域变得越来越干燥。
-
台风
台风提前
台风强度增强
-
沃克环流
海洋生态
-
海洋荒漠化
进入海洋上层的营养盐通过平流输送、海洋柱内的垂直混合和海-气界面的大气沉降等动力过程来调节Chl - a的变化
-
物种多样性
图表
IPCC-SPECIAL REPORT: GLOBAL WARMING OF 1.5 ºC

Evolution of global mean surface temperature (GMST) over the period of instrumental observations.
Grey shaded line shows monthly mean GMST in the HadCRUT4, NOAAGlobalTemp, GISTEMP and Cowtan-Way datasets, expressed as departures from 1850–1900, with varying grey line thickness indicating inter-dataset range. All observational datasets shown represent GMST as a weighted average of near surface air temperature over land and sea surface temperature over oceans. Human-induced (yellow) and total (human- and naturally-forced, orange) contributions to these GMST changes are shown calculated following Otto et al. (2015

Spatial and seasonal pattern of present-day warming.
Regional warming for the 2006–2015 decade relative to 1850–1900 for the annual mean (top), the average of December, January, and February (bottom left) and for June, July, and August (bottom right). Warming is evaluated by regressing regional changes in the Cowtan and Way
IPCC06_SROCC_Ch04_FINAL
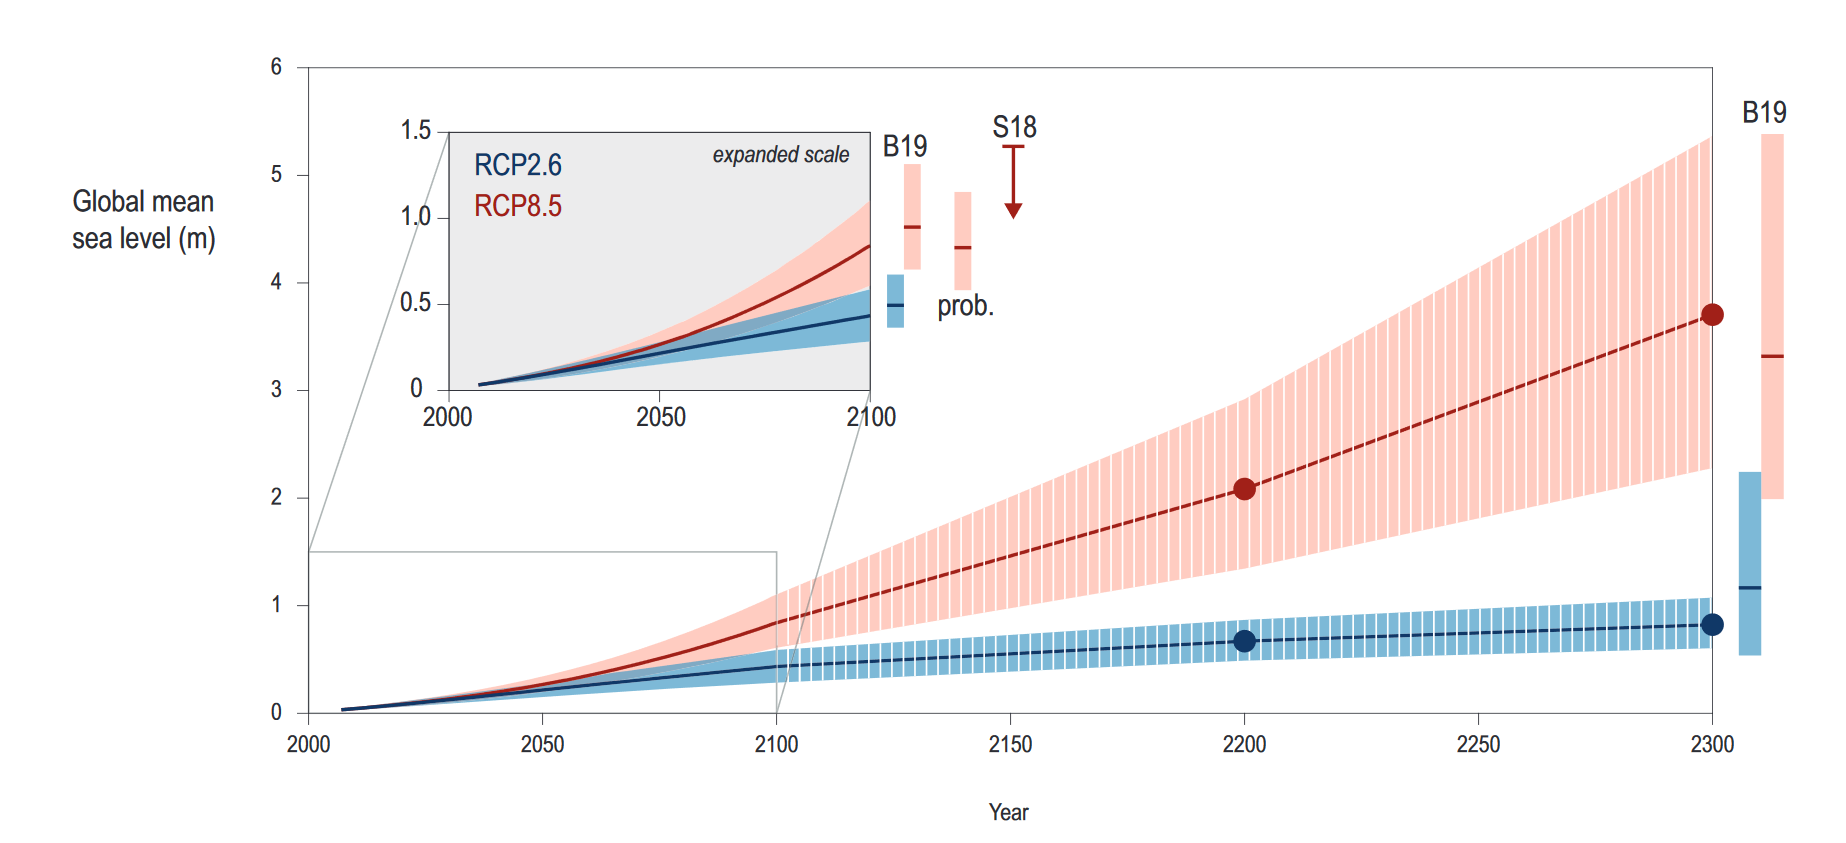
Projected sea level rise (SLR) until 2300. The inset shows an assessment of the likely range of the projections for RCP2.6 and RCP8.5 up to 2100 (medium confidence). Projections for longer time scales are highly uncertain but a range is provided (4.2.3.6; low confidence). For context, results are shown from other estimation approaches in 2100 and 2300. The two sets of two bars labelled B19 are from an expert elicitation for the Antarctic component (Bamber et al., 2019), and reflect the likely range for a 2ºC and 5ºC temperature warming (low confidence; details section 4.2.3.3.1). The bar labelled “prob.” indicates the likely range of a set of probabilistic projections (4.2.3.2). The arrow indicated by S18 shows the result of an extensive sensitivity experiment with a numerical model for the Antarctic Ice Sheet (AIS) combined, like the results from B19 and “prob.”, with results from Church et al. (2013) for the other components of SLR. S18 also shows the likely range.
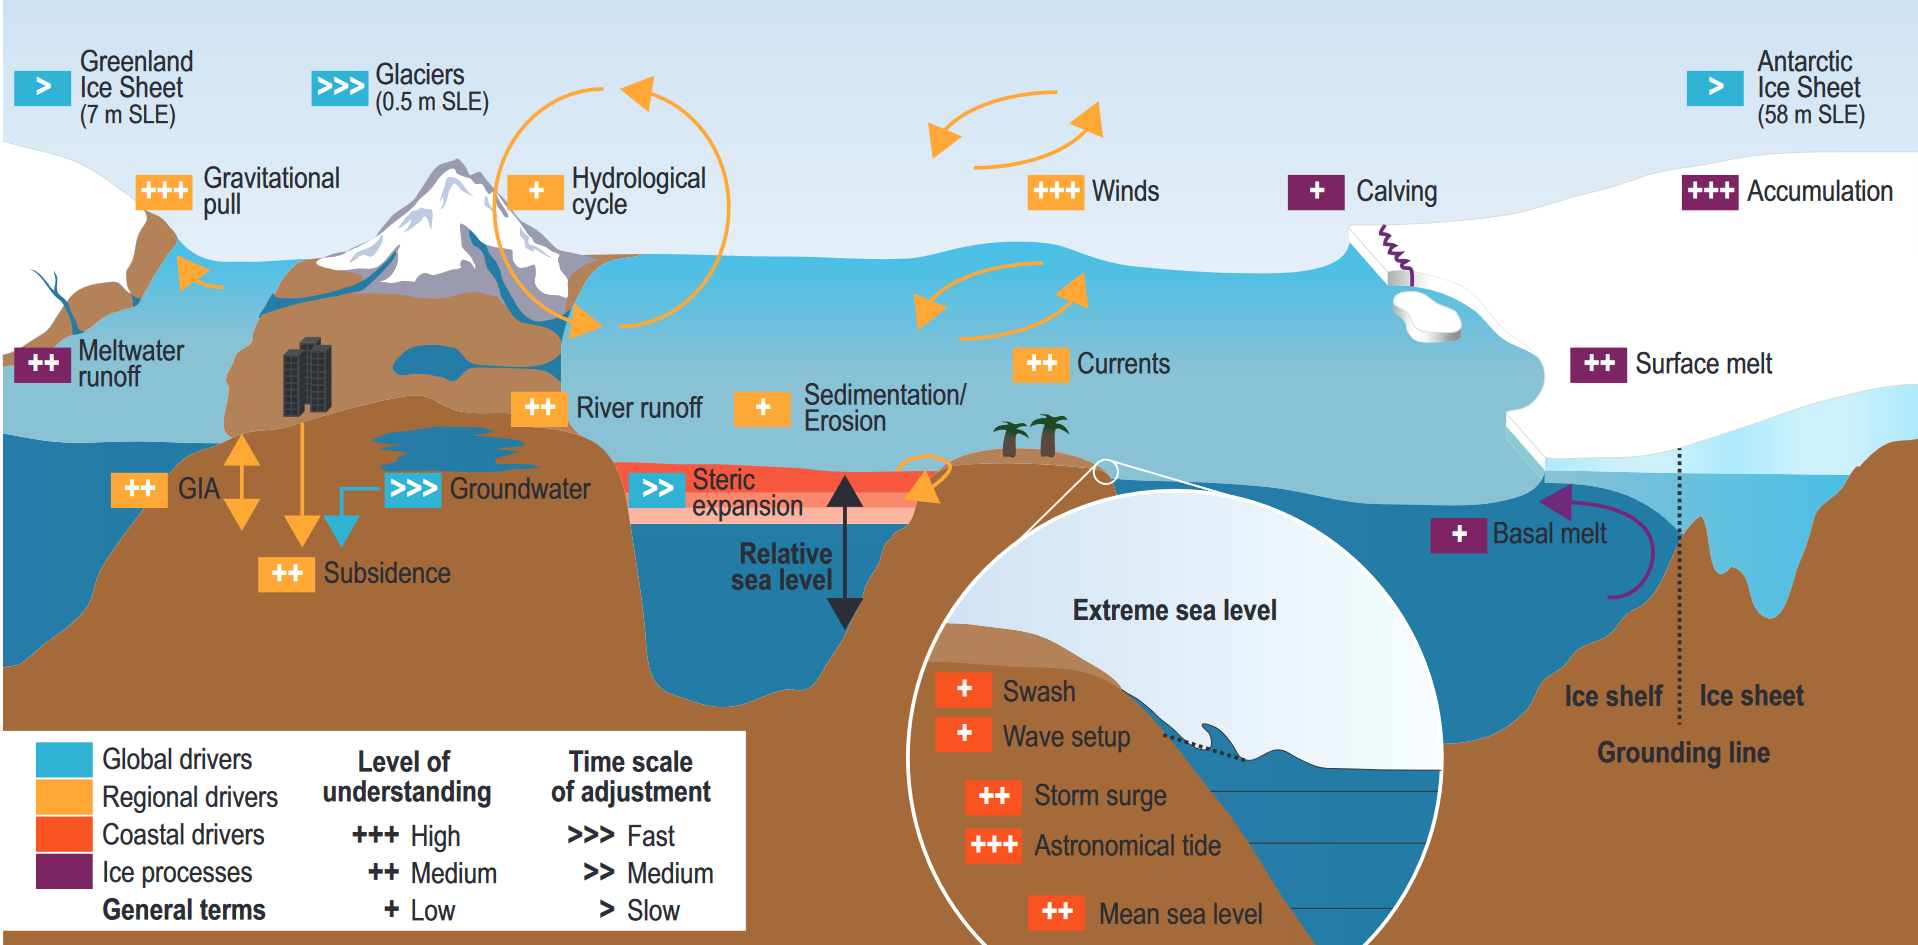
A schematic illustration of the climate and non-climate driven processes that can influence global, regional (green colours), relative and extreme sea level (ESL) events (red colours) along coasts. Major ice processes are shown in purple and general terms in black. SLE stands for Sea Level Equivalent and reflects the increase in GMSL if the mentioned ice mass is melted completely and added to the ocean.
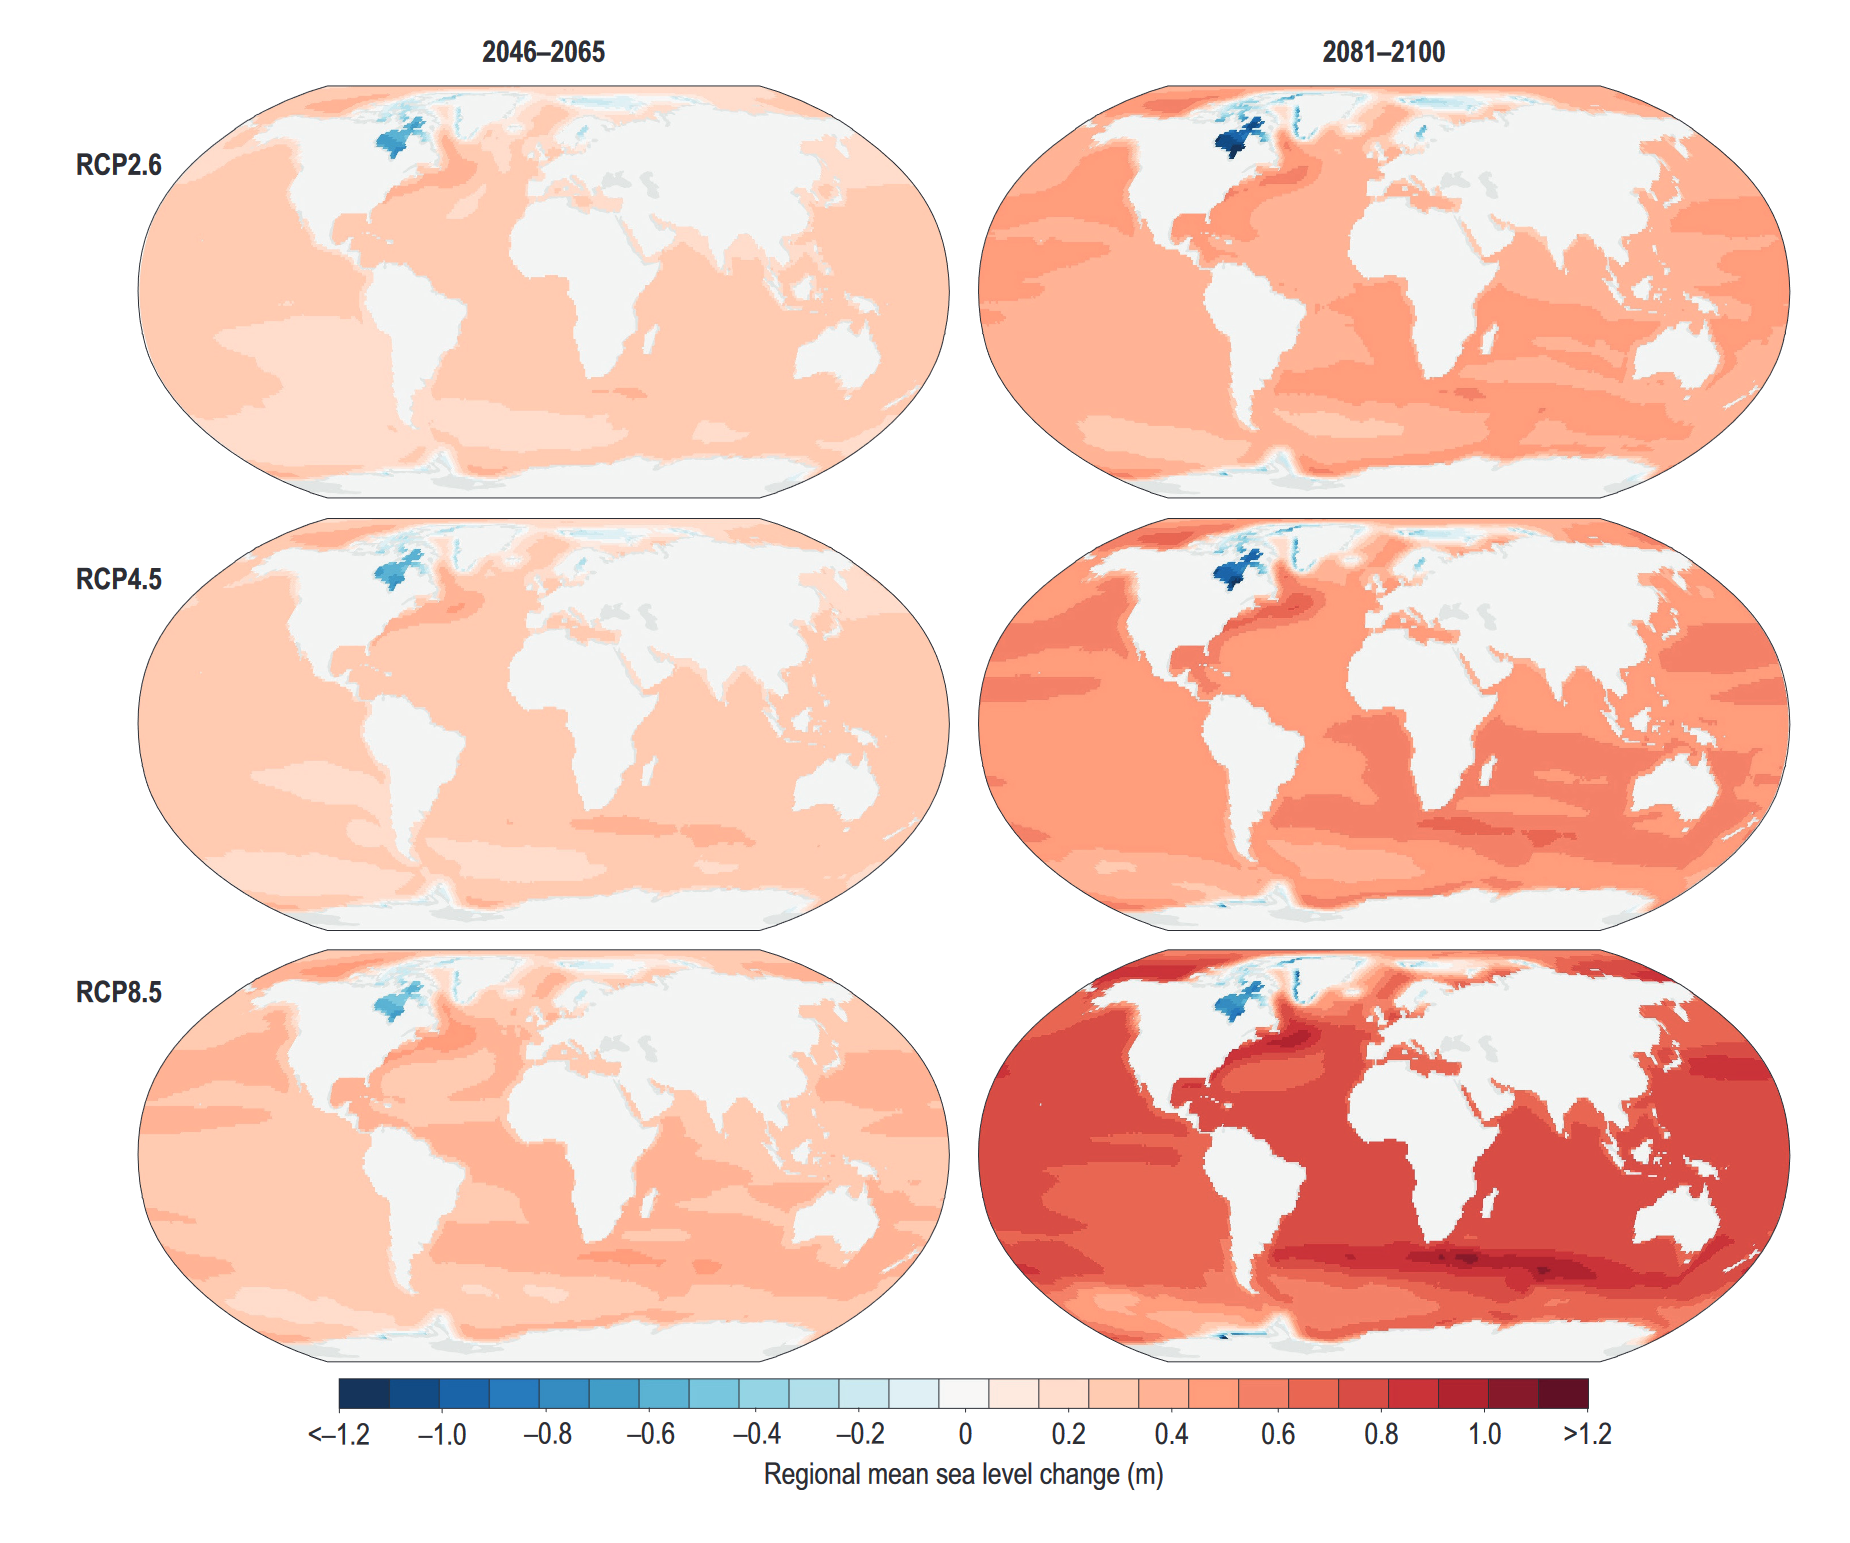
Regional sea level change for RCP2.6, RCP4.5 and RCP8.5 in metres as used in this report for extreme sea level (ESL) events. Results are median values based on the values in Table 4.4 for Antarctica including GIA and the gravitational and rotational effects, and results by Church et al. (2013) for glaciers, land water storage (LWS) and Greenland. The left column is for the time slice 2046–2065 and the right column for 2081–2100.


 139
139

 被折叠的 条评论
为什么被折叠?
被折叠的 条评论
为什么被折叠?
 到【灌水乐园】发言


