


在一个页面里有一个div存放一个图表

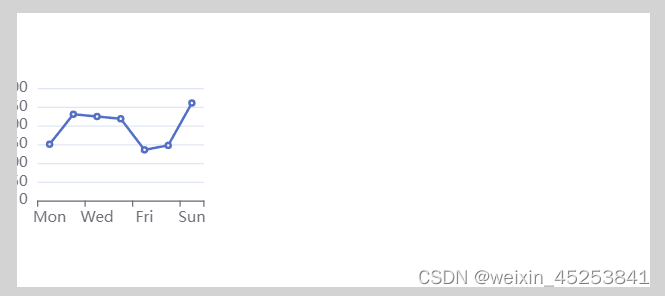
使用基础折线图

发现不会根据父元素的大小来自适应
<template>
    <div class="box" id="rightMain">
    </div>
</template>
<script setup>
import * as echarts from 'echarts/lib/echarts';
import 'echarts/lib/component/grid';
import 'echarts/lib/chart/line';


import { onMounted, ref } from 'vue'

const chartDom = ref('')
let myChart
const option = ref(null)

onMounted(() => {
    chartDom.value = document.getElementById('rightMain');
    myChart = echarts.init(chartDom.value);
    option.value = {
        xAxis: {
            type: 'category',
            data: ['Mon', 'Tue', 'Wed', 'Thu', 'Fri', 'Sat', 'Sun']
        },
        yAxis: {
            type: 'value'
        },
        series: [
            {
                data: [150, 230, 224, 218, 135, 147, 260],
                type: 'line'
            }
        ]
    };

    option.value && myChart.setOption(option.value);
})

</script>
<style scoped>
.box {
    width: 100%;
    height: 100%;
}
</style>
通过询问chatgpt
问题是由于样式 scoped 的限制,导致在 Vue 组件的 <style> 中使用的类选择器 .box 并没有正确地应用到在 JavaScript 部分使用的 chartDom 元素上,从而影响了图表容器的大小。这是由于 Vue 的样式隔离机制,它使得类选择器只在组件内部生效。
解决办法:
把类选择器改为id选择器,成功解决问题。
<template>
    <div id="rightMain">
    </div>
</template>
<script setup>
import * as echarts from 'echarts/lib/echarts';
import 'echarts/lib/component/grid';
import 'echarts/lib/chart/line';


import { onMounted, ref } from 'vue'

const chartDom = ref('')
let myChart
const option = ref(null)

onMounted(() => {
    chartDom.value = document.getElementById('rightMain');
    myChart = echarts.init(chartDom.value);
    option.value = {
        xAxis: {
            type: 'category',
            data: ['Mon', 'Tue', 'Wed', 'Thu', 'Fri', 'Sat', 'Sun']
        },
        yAxis: {
            type: 'value'
        },
        series: [
            {
                data: [150, 230, 224, 218, 135, 147, 260],
                type: 'line'
            }
        ]
    };

    option.value && myChart.setOption(option.value);
})

</script>
<style scoped>
#rightMain {
    width: 100%;
    height: 100%;
}
</style>


 6580
6580


 被折叠的 条评论
为什么被折叠?
被折叠的 条评论
为什么被折叠?
 到【灌水乐园】发言


