


一、效果展示
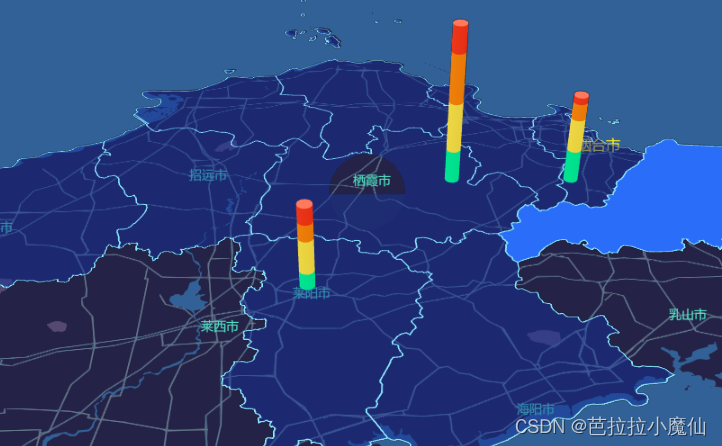
二、地图组件: vue-mapvgl
https://docs.guyixi.cn/vue-mapvgl/#/
三、代码
main.js
//vue-mapvGL
import VueBMap from 'vue-bmap-gl';
import 'vue-bmap-gl/dist/style.css'
import VueMapvgl  from 'vue-mapvgl';
Vue.use(VueBMap);
Vue.use(VueMapvgl);
VueBMap.initBMapApiLoader({
  ak: ak,
  v: '1.0'
});
yantaiMap.vue
<template>

    <div class="globalLayout">
		<el-bmap vid="bmapDemo" ref="bmapDemo" :mapStyleV2="mapStyle" :tilt="60" :heading="0" 		:zoom="zoom" :center="center" class="bmap-View">
            <el-bmapv-view>
              <el-bmapv-bar-layer
                :data="barData"
                :edge-count="50"
                :size = "200">
                </el-bmapv-bar-layer>
                <el-bmapv-ripple-layer
                  :data="rippleData"
                  >
                </el-bmapv-ripple-layer>
                <el-bmapv-polygon-layer  v-for="(item,index) in yantaiGeometry"
                  :key="'yantai'+index"
                  :enablePicked="true"
                  selectedColor="rgba(42, 109, 249, 1)"
                  line-join="miter"
                  line-color="rgba(137, 227, 250, 1)"
                  fillColor="rgba(26, 72, 224, .7)"
                  :line-width="2"
                  :data="item"
                  >
                </el-bmapv-polygon-layer>
            </el-bmapv-view>
          </el-bmap>

    </div>
  </template>

  <script>
  //百度个性定制https://lbsyun.baidu.com/apiconsole/custommap
  import styleJson from '../../assets/baiduMap/mapStyle.json'
  //烟台地图geoJson
  //https://geo.datav.aliyun.com/areas_v3/bound/370600_full.json
  import yantaiJson from '../../assets/baiduMap/yantai.json'

    export default {
      name: 'bmap-page',
      computed:{
        mapStyle:function(){
          let style = {
            styleJson:styleJson
          }
          return style;
        }
        yantaiGeometry:function(){
          let arr = yantaiJson.features;
          let mapArr = []
          arr.forEach((item,index) => {
            let regionName = item.properties.name;
            let geometry = item.geometry;
            let mapItem = [{
              regionName,
              geometry,
              properties:{
                height:5
              }
            }]
            mapArr.push(mapItem);
          });
          return mapArr;
        },
        lineData:function(){
           let line = [{
              geometry:yantaiJson.features[0].geometry ,
              properties: {
                  height: 500
              }
          }]
          return line;
        }
      },
      data() {

        return {
          boxBackgroundColor:'rgba(0, 11, 41, .7)',
          count: 1,
          zoom: 10,
          center: [120.786975, 36.943199],
          barData:[
            {
              geometry: {
                  type: 'Point',
                  coordinates: [121.05863804, 37.34544754],
              },
              value: [100,150,150,80],
              height: function (value, index, array) {
                  return value * 100;
              },
              size: 2 * 1000,
              color: ['rgba(9, 244, 162, 1)', 'rgba(253, 230, 84, 1)',  'rgba(255, 143, 28, 1)','rgba(251, 70, 41, 1)']
            },
            {
              geometry: {
                  type: 'Point',
                  coordinates: [120.70863804, 37.00544754],
              },
              value: [50,100,50,50],
              height: function (value, index, array) {
                  return value * 100;
              },
              size: 2 * 1000,
              color: ['rgba(9, 244, 162, 1)', 'rgba(253, 230, 84, 1)',  'rgba(255, 143, 28, 1)','rgba(251, 70, 41, 1)']
            },
            {
              geometry: {
                  type: 'Point',
                  coordinates: [121.35863804, 37.34544754],
              },
              value: [100,100,50,20],
              height: function (value, index, array) {
                  return value * 100;
              },
              size: 2 * 1000,
              color: ['rgba(9, 244, 162, 1)', 'rgba(253, 230, 84, 1)',  'rgba(255, 143, 28, 1)','rgba(251, 70, 41, 1)']
            },
          ],
          sparkHeight(data){
            return data.properties.height;
          },
          rippleData: [
              {
                geometry: {
                    type: 'Point',
                    coordinates: [120.84443667, 37.29848811],
                },
                properties: {
                  size: 100,
                  color: '#ffeb3b'
                }
              },
            ]

        };
      },
      mounted(){
        console.log(this.yantaiGeometry)
      },
      methods: {
      }
    };
</script>
四、心路历程
搞了两天终于出来比较满意的效果。下面讲讲我的试错历程:
最开始使用vue-baidu-map,vue-baidu-map使用的百度api是2.0版本,地图渲染采用的是瓦片图,使用map.setMapStyle个性定制地图是总会出现瓦片图片加载失败的情况,体验感不好。在网上搜解决方案是使用3.0版本,map.setMapStyleV2,3.0版本使用webGl渲染图片。3.0没有瓦片加载失败的问题,但是当按住鼠标拖拽是页面会有重影,这个问题不知如何解决。使用3.0还有一个问题就是使用new BMap.Boundary()绘制行政区域回报错,可能是api升级方法改了?没有时间做研究着急要效果,在网上搜到了vue-mapvgl这个地图组件库。于是舍弃之前的方法,尝试使用vue-mapvgl。
vue-baidu-map api改为3.0版本参考文章:
https://www.cnblogs.com/raonet/p/14898367.html
最终,使用vue-mapvgl的平面图层el-bmapv-polygon-layer实现行政区域绘制,这里讲一下思路。
vue-mapvgl官网给出的el-bmapv-polygon-layer绘制平面图层所需的数据格式
 //vue-mapvgl官网给出的el-bmapv-polygon-layer绘制平面图层所需的数据格式
 data: [{
       geometry: {
           type: 'Polygon',
           coordinates: [
             [
                 [121.5273285, 31.21515044],
                 [121.5373285, 31.21515044],
                 [121.5373285, 31.22515044],
                 [121.5273285, 31.22515044]
             ]
           ],
       },
       properties: {
           height: 0
       }
   }]
烟台geoJson的数据,这里推荐一个json可视化工具,很好用。https://altearius.github.io/tools/json/index.html
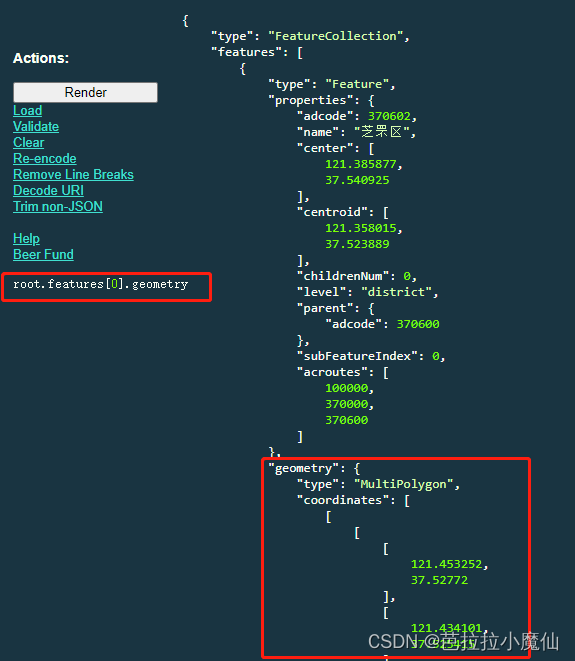
绘制区域只需要geoJson中的geometry数据即可,烟台地图geoJson里有每个区的geometry,所以只需要把这些数据拿出来就可以了;
yantaiGeometry:function(){
          let arr = yantaiJson.features;
          let mapArr = []
          arr.forEach((item,index) => {
            let regionName = item.properties.name;
            let geometry = item.geometry;
            let mapItem = [{
              regionName,//区县的名称
              geometry,//绘制平面图层需要的数据
              properties:{
                height:5
              }
            }]
            mapArr.push(mapItem);
          });
          return mapArr;
        },
以上实现了烟台市各区县行政区绘制,但是有一个问题截止到2023–04-21,从各个平台找的geoJson都没有高新区,为了解决这个问题,我打算使用阿里云的数据可视化地图边界生成器,大致画一下高新区,在使用得到的GeoJson绘制高新区。因为我们的项目对具体的地理位置要求不严格,只是做一个地图的可视化展示,所以地图上有高新区的大致位置就可以了。
http://datav.aliyun.com/portal/school/atlas/area_generator#10.04/121.482587/37.461168


 2033
2033


 被折叠的 条评论
为什么被折叠?
被折叠的 条评论
为什么被折叠?
 到【灌水乐园】发言


