


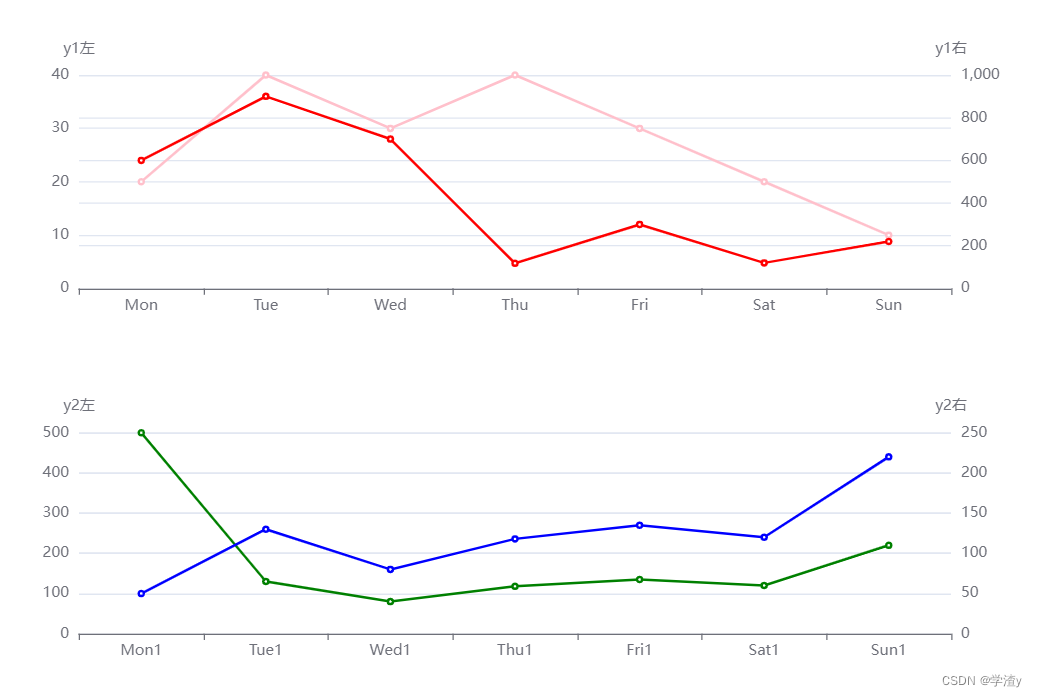
效果如下
配置项
option = {
  xAxis: [
    {
      type: 'category',
      data: ['Mon', 'Tue', 'Wed', 'Thu', 'Fri', 'Sat', 'Sun']
    },
    {
      type: 'category',
      gridIndex: 1,
      data: ['Mon1', 'Tue1', 'Wed1', 'Thu1', 'Fri1', 'Sat1', 'Sun1']
    },
  ],
  yAxis: [
    {
      name: 'y1左',
      type: 'value',
      gridIndex: 0
    },
    {
      name: 'y1右',
      type: 'value',
      // position: 'right',
      gridIndex: 0
    },
    {
      name: 'y2左',
      gridIndex: 1
    },
    {
      name: 'y2右',
      //position: 'right',
      gridIndex: 1
    }
  ],
  grid: [
    {
      bottom: '60%'
    },
    {
      top: '60%'
    }
  ],
  series: [
    {
      data: [20, 40, 30, 40, 30, 20, 10],
      type: 'line',
      color: 'pink',
    },
    {
      data: [600, 900, 700, 118, 300, 120, 220],
      type: 'line',
      color: 'red',
      xAxisIndex: 0,
      yAxisIndex: 1
    },
    {
      data: [500, 130, 80, 118, 135, 120, 220],
      type: 'line',
      color: 'green',
      xAxisIndex: 1,
      yAxisIndex: 2
    },
    {
      data: [50, 130, 80, 118, 135, 120, 220],
      type: 'line',
      color: 'blue',
      xAxisIndex: 1,
      yAxisIndex: 3
    },
  ]
};
双图表双y轴需要有四个y轴对象
- yAxis - position:
y 轴的位置可选['left', 'right'],默认 grid 中的第一个y轴在grid的左侧,第二个 y 轴视第一个 y 轴的位置放在另一侧。注:若未将yAxis.axisLine.onZero设为false, 则该项无法生效 - yAxis - gridIndex:
y 轴所在的grid的索引,默认位于第一个grid。
series配置通过 xAxisIndex 和 yAxisIndex 表示线要根据哪个x轴、y轴来展示
通过上面对 xAxis 和 yAxis 配置。
xAxisIndex选值[0, 1]yAxisIndex选值[0, 1, 2, 3]


 1万+
1万+


 被折叠的 条评论
为什么被折叠?
被折叠的 条评论
为什么被折叠?
 到【灌水乐园】发言


