


 jQWidgetv18引入了全新的Gantt组件,提供类似MicrosoftProject的界面,支持Angular和JavaScript开发,用于创建交互式和响应式的项目时间线管理。该组件有助于开发者可视化和管理任务、依赖关系和资源。
Add Gantt Charts to your JavaScript Projects
jQWidgets version 18 introduces a new Gantt component that provides a Microsoft Project-like interface to display and manage hierarchical tasks on a timeline.
jQWidgets is a comprehensive JavaScript library that provides a wide range of UI widgets for building web applications. It includes over 60 widgets, including grids, charts, calendars, and editors, which are highly customizable and can easily be styled to match any application.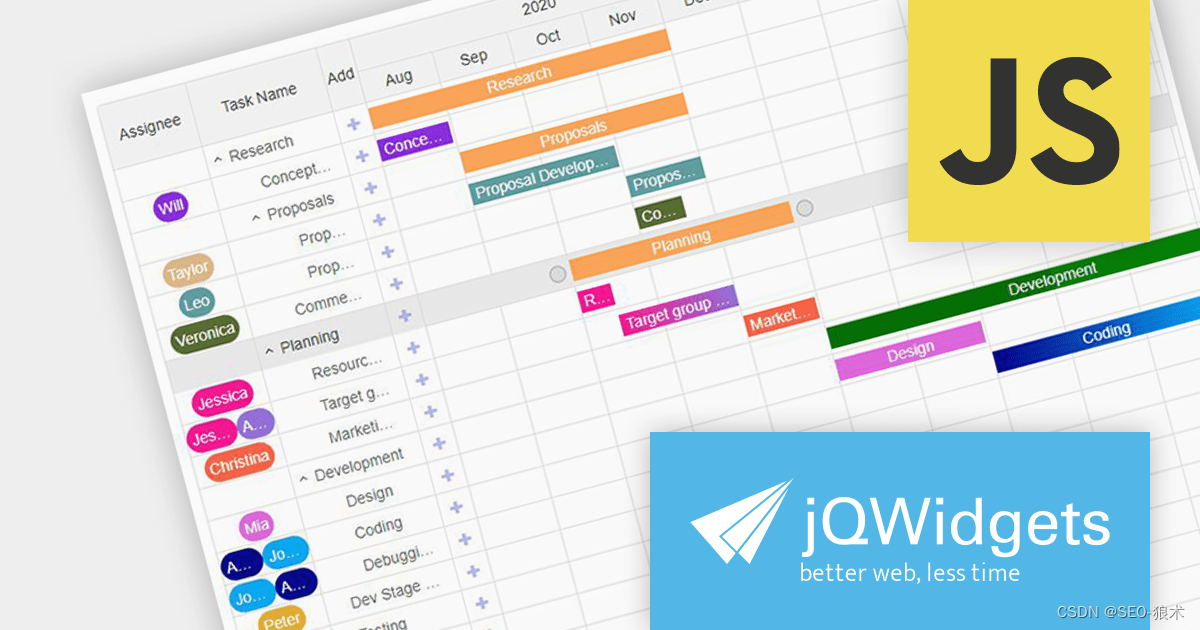
Version 18.0.0 includes a new Gantt component for Angular and JavaScript. jqxGantt is a project planning and management tool which provides a Microsoft Project-like interface, empowering developers to create interactive and responsive Gantt charts. This powerful new component helps users to visualize and manage project timelines, dependencies, and resources.


 被折叠的 条评论
为什么被折叠?
被折叠的 条评论
为什么被折叠?
 到【灌水乐园】发言


