


 本文讲述了代码剖析作为诊断工具,帮助开发者分析应用运行时行为,识别CPU时间、内存分配和函数调用频率等性能瓶颈,以便针对性优化,改善用户体验和提升应用的稳定性和效率。
Optimize Your App's Performance
Profiling code allows developers to analyze their program's execution time and identify bottlenecks for performance optimization.
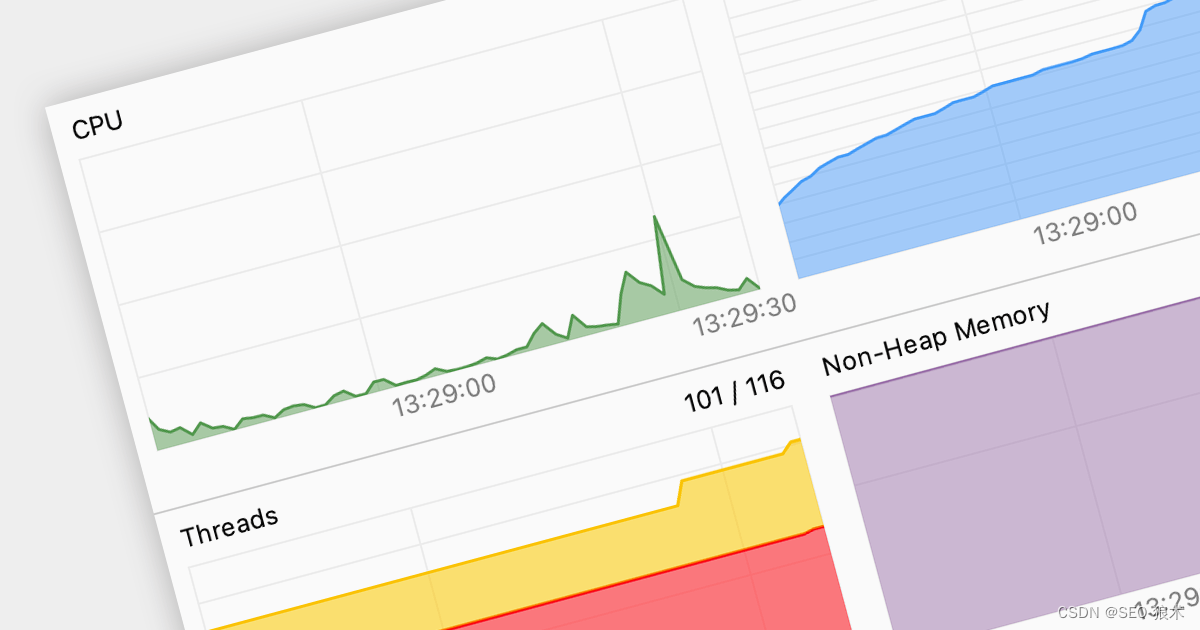
Code profiling is a diagnostic technique employed to analyze the runtime behavior of an application. It dissects resource consumption, usually including CPU time, memory allocation, and function call frequency, to precisely identify performance bottlenecks and resource hogs. Armed with these insights, developers can optimize specific code sections, leading to improved user experience, resource efficiency, and ultimately, a more robust and performant application.


 91
91


 被折叠的 条评论
为什么被折叠?
被折叠的 条评论
为什么被折叠?
 到【灌水乐园】发言


