


from pptx import Presentation
ppt = Presentation()
title_slide_layout=ppt.slide_layouts[3]
slide=ppt.slides.add_slide(title_slide_layout)
title=slide.shapes.title
subtitle=slide.placeholders[1]
title.text='Hello,World!'
subtitle.text='这是python-pptx库'
f=r'test.pptx'
ppt.save(f)
print('Game Over!')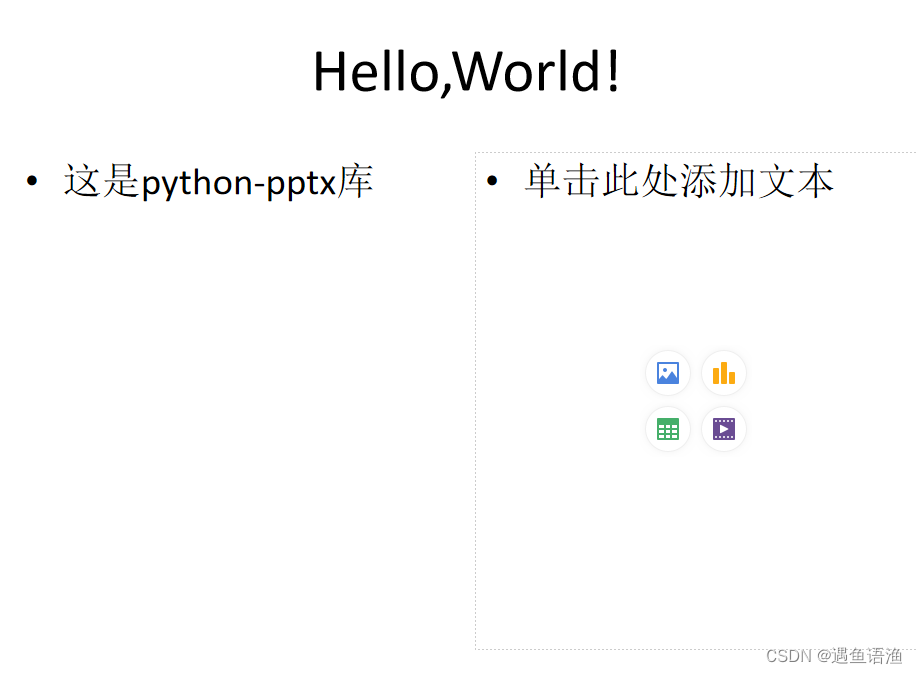
from docx.shared import Cm
SLD_LAYOUT_TITLE_ONLY=5
from pptx import Presentation
f=r'test.pptx'
ppt=Presentation(f)
title_slide_layout=ppt.slide_layouts[SLD_LAYOUT_TITLE_ONLY]
print('添加一页幻灯片。')
slide=ppt.slides.add_slide(title_slide_layout)
title=slide.shapes.title
title.text='这是一个只有标题的版式'
image_url='下载1.png'
slide.shapes.add_picture(image_file=image_url,
                         left=Cm(2),
                         top=Cm(4.54),
                         width=Cm(20.4),
                         height=Cm(12.7)
                            )
ppt.save(f)
print('game over') 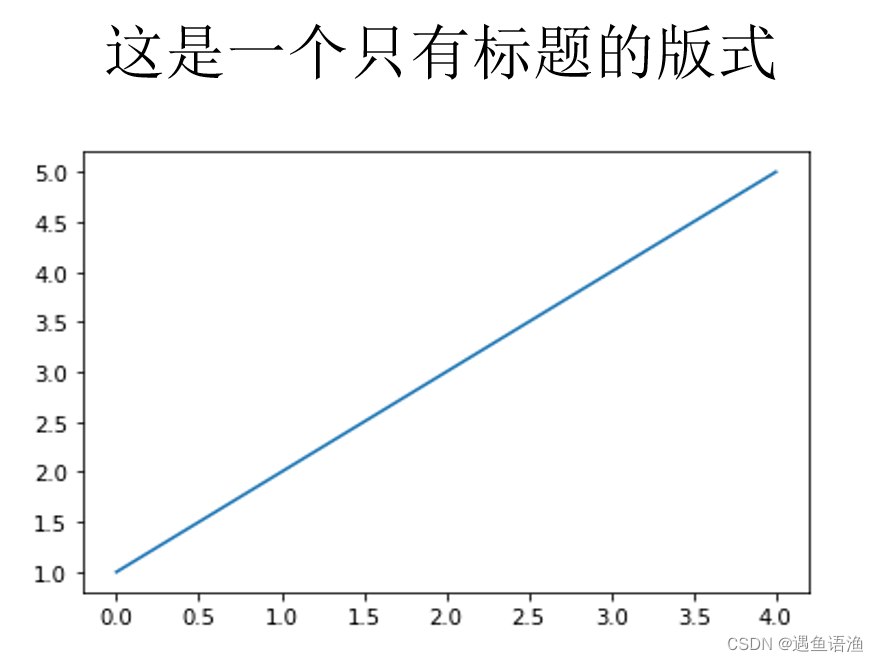
from docx.shared import Cm
SLD_LAYOUT_TITLE_ONLY=5
from pptx import Presentation
f=r'test.pptx'
ppt=Presentation(f)
title_slide_layout=ppt.slide_layouts[SLD_LAYOUT_TITLE_ONLY]
print('添加一页幻灯片。')
slide=ppt.slides.add_slide(title_slide_layout)
title=slide.shapes.title
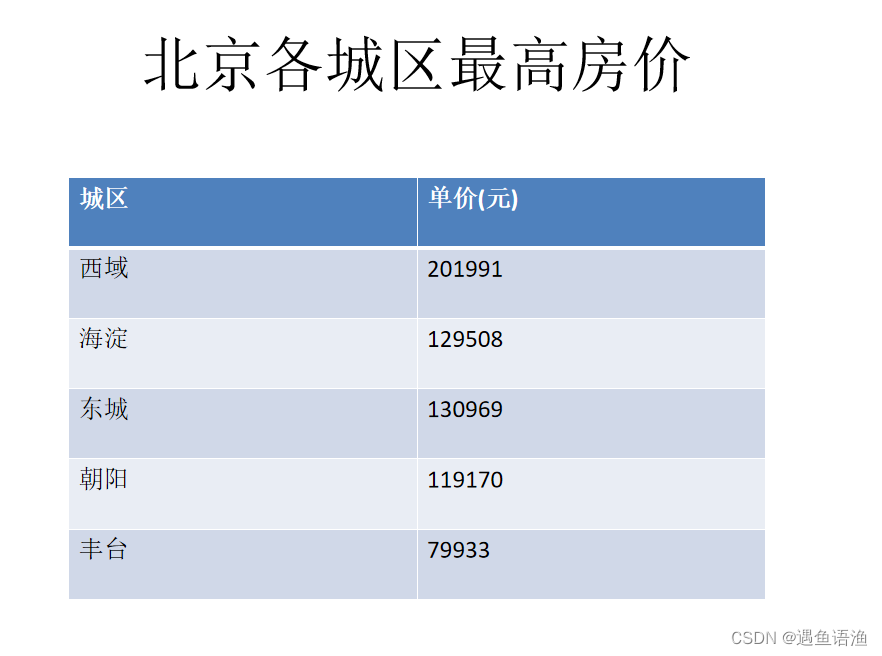
title.text='北京各城区最高房价'
shape=slide.shapes.add_table(rows=6,
cols=2,
left=Cm(3.89),
top=Cm(5.21),
width=Cm(17.63),
height=Cm(10.66)
)
table=shape.table
records=[
('西域',201991),
('海淀',129508),
('东城',130969),
('朝阳',119170),
('丰台',79933)
]
hdr_cells=table.rows[0].cells
hdr_cells[0].text='城区'
hdr_cells[1].text='单价(元)'
for index,value in enumerate(records):
addr_dist,price=value
row_cells=table.rows[index+1].cells
row_cells[0].text=addr_dist
row_cells[1].text=str(price)
ppt.save(f)
print('game over')
from docx.shared import Cm
from pptx.chart.data import CategoryChartData
from pptx.enum.chart import XL_CHART_TYPE
SLD_LAYOUT_TITLE_ONLY=5
from pptx import Presentation
f= r'test.pptx'

#打开 PPT 文档
ppt = Presentation(f)

#选择母版中的第6个幻灯片版式,该版式是只有标题的版式

title_slide_layout = ppt.slide_layouts[SLD_LAYOUT_TITLE_ONLY]
print('添加一页幻灯片')
#添加一页幻灯片

slide = ppt.slides.add_slide(title_slide_layout)

title = slide.shapes.title

#获取幻灯片的标题

title.text ='北京各城区最高房价'
#设置标题文本

chart_data =CategoryChartData()

#设置×轴数据

chart_data.categories =['西城','海淀','朝阳','丰台','东城']
#设置 y 轴数据

chart_data.add_series ('平均价',(201900,129500,130900,119100,79900))
#获取图表对象

shape = slide.shapes.add_chart(chart_type = XL_CHART_TYPE.COLUMN_CLUSTERED ,

    x = Cm(3.89),

    y = Cm(5.21),

    cx = Cm(17.63),

    cy = Cm(10.66),

    chart_data = chart_data )

agechart = shape.chart

X_axis = agechart.category_axis
X_axis_title = X_axis.axis_title
X_axis_title.text_frame.text ='城区'
y_axis = agechart.value_axis
y_axis_title = y_axis.axis_title
y_axis_title.text_frame.text='单价(元)'
ppt.save(f)
print('game over') 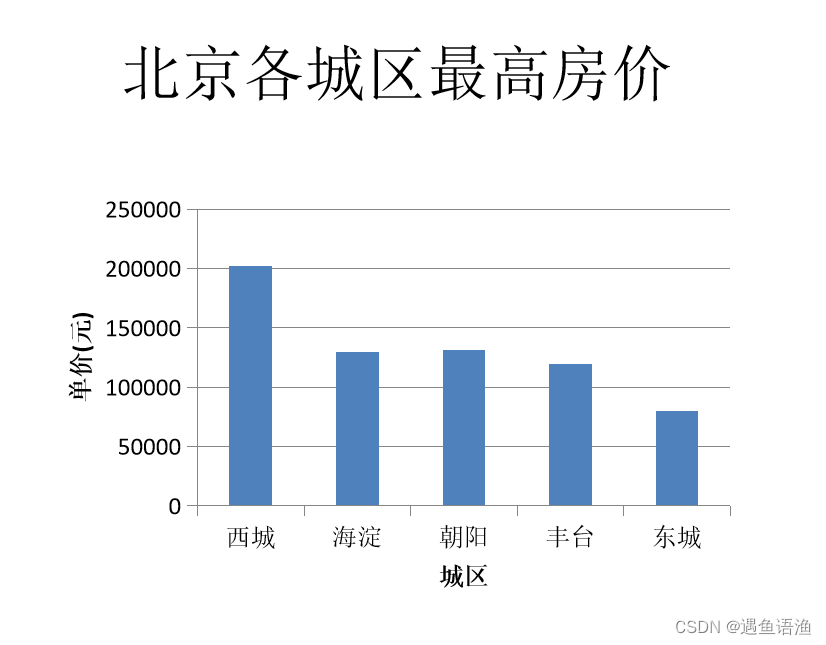


 1216
1216


 被折叠的 条评论
为什么被折叠?
被折叠的 条评论
为什么被折叠?
 到【灌水乐园】发言


