


谨以此篇献 给那些在 用echarts做中国地图 很懊恼的程序媛(员) 真的不想让你们在走弯路
节省时间去刷刷抖音他不香吗??
1、在echarts的官网上 根据命令安装
npm install echarts --save2、echarts3.0版本之后 已经不再跟中国地图相关的json、js文件了
我们需要到github上下载china.js文件引入到vue文件里
地址:GitHub - liangrumeng2015/China.js: echarts里面的地图文件China.js
一定要从这里面下载,在别人的百度网盘里下载,很有可能会出错(我就差点被淹死在这里)
3、china.js引入到我们的vue文件里
<template>
  <div class="mapChart">
    <h2 class="title-item">{{ title }}</h2>
    <div :id="id" class="midtop"></div>
  </div>
</template>
<script>
import * as echarts from "echarts";
import "@/assets/china.js";
export default {
  name: "MapChart",
  mixins: [resize],
  props: {
    id: {
      type: String,
      default: "",
      required: true,
    },
    chartData: {
      type: Array,
      default: () => [],
      required: true,
    },
    title: {
      type: String,
      default: "",
      required: true,
    },
  },
  data() {
    return {
      chart: null,
    };
  },
  watch: {
    chartData: {
      deep: true,
      handler(val) {
        this.setOptions(val);
      },
    },
  },
  beforeDestroy() {
    if (!this.chart) {
      return;
    }
    this.chart.dispose();
    this.chart = null;
  },
  mounted() {
    this.$nextTick(() => {
      this.initChart();
    });
  },
  methods: {
    initChart() {
      this.chart = echarts.init(document.getElementById(this.id));
      this.setOptions(this.chartData);
      this.chart.on('click',function(params){
        console.log(params.name);
      })
    },
    setOptions(data = []) {
      this.chart.setOption({
        tooltip: {
          trigger: "item",
          formatter: "{b}<br/>{c} (人)",
        },
        toolbox: {
          show: true,
          orient: "vertical",
          left: "right",
          top: "center",
          feature: {
            dataView: { readOnly: false },
            restore: {},
            saveAsImage: {},
          },
        },
        visualMap: {
          min: 800,
          max: 50000,
          text: ["High", "Low"],
          realtime: false,
          calculable: true,
          left:'5%',
          bottom:'8%',
          textStyle:{
            color:"#fff"
          },
          color:'#fff',
          inRange: {
            color: ["lightskyblue", "yellow", "orangered"],
          },
        },
        series: [
          {
            type: "map",
            map: "china",
            label: {
              show: true,
              color:'yellow'
            },
            data,
          },
        ],
      });
    },
  },
};
</script>
<style scoped lang='scss'>
.mapChart {
  .title-item {
    text-align: center;
    width: 100%;
    font-size: 12px;
    font-weight: normal;
    letter-spacing: 2px;
    font-weight: normal;
    overflow: hidden;
  }
  .midtop {
    width: 99%;
    height: 430px;
  }
}
</style>
到这里,我的就可以显示了,你们快去验证一下吧。
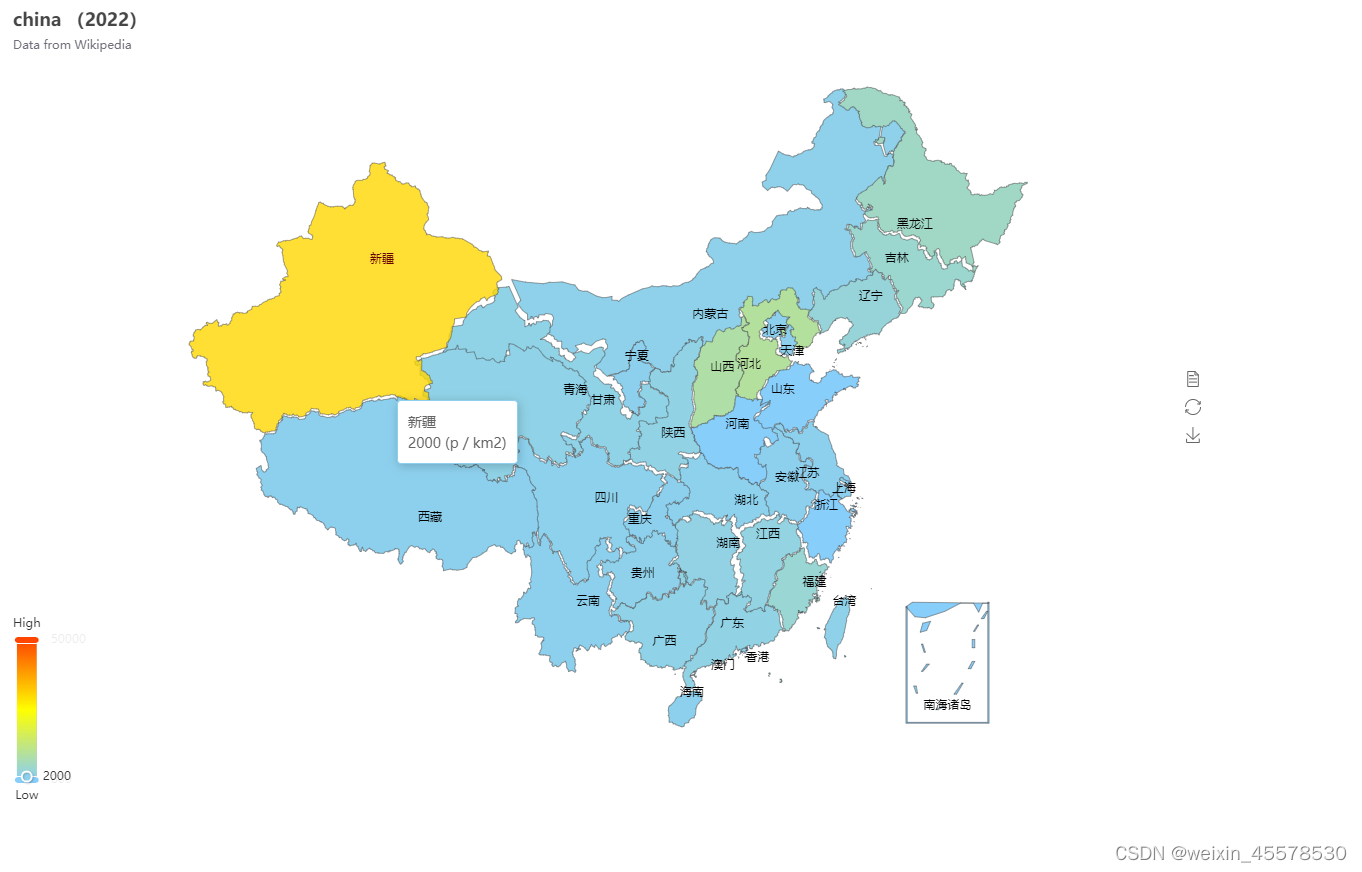
不要放弃哦~


 2212
2212

 被折叠的 条评论
为什么被折叠?
被折叠的 条评论
为什么被折叠?
 到【灌水乐园】发言


