import numpy as np
import pandas as pd
import matplotlib. pylab as plt
plt. rcParams[ 'font.sans-serif' ] = [ 'SimHei' ]
plt. rcParams[ 'axes.unicode_minus' ] = False
plane= pd. read_excel( './航空数据.xls' )
plane. head( )
plane. info( )
des= plane. describe( )
des
len ( plane) - des. loc[ 'count' ]
plane[ plane. isnull( ) . values== True ]
plane. columns= plane. columns. map ( lambda x: x. upper( ) )
airline_notnull = plane. loc[ plane[ 'SUM_YR_1' ] . notnull( ) & plane[ 'SUM_YR_2' ] . notnull( ) , : ]
print ( '删除缺失记录后数据的形状为:' , airline_notnull. shape)
index1 = airline_notnull[ 'SUM_YR_1' ] != 0
index2 = airline_notnull[ 'SUM_YR_2' ] != 0
index3 = ( airline_notnull[ 'SEG_KM_SUM' ] > 0 ) & ( airline_notnull[ "AVG_DISCOUNT" ] != 0 )
index4 = airline_notnull[ 'AGE' ] > 100
plane = airline_notnull[ ( index1 | index2) & index3 & ~ index4]
print ( '数据清洗后数据的形状为:' , plane. shape)
plane_1= plane. loc[ : , [ "FFP_DATE" , "LOAD_TIME" , "LAST_TO_END" , "FLIGHT_COUNT" , "SEG_KM_SUM" , "AVG_DISCOUNT" ] ]
plane_1. head( )
plane_1. describe( )
res= plane_1[ 'LOAD_TIME' ] - plane_1[ 'FFP_DATE' ]
plane_1[ 'L' ] = res. map ( lambda x: x / np. timedelta64( 30 * 24 * 60 , 'm' ) )
plane_1. head( )
plane_1[ 'R' ] = plane[ 'LAST_TO_END' ]
plane_1[ 'F' ] = plane[ 'FLIGHT_COUNT' ]
plane_1[ 'M' ] = plane[ 'SEG_KM_SUM' ]
plane_1[ 'C' ] = plane[ "AVG_DISCOUNT" ]
plane_2= plane_1[ [ 'L' , 'R' , 'F' , 'M' , 'C' ] ]
plane_2. head( )
from sklearn. preprocessing import StandardScaler
from sklearn. cluster import KMeans
plane= StandardScaler( ) . fit_transform( plane_2)
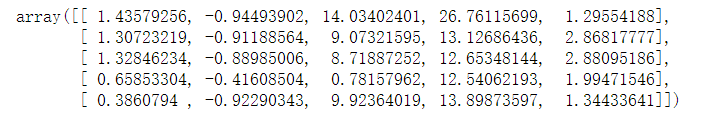
plane[ : 5 , : ]
k= 5
kmeans_model= KMeans( n_clusters= k, n_jobs= 4 )
fit_kmeans= kmeans_model. fit( plane)
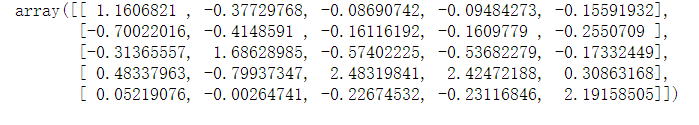
cen= kmeans_model. cluster_centers_
cen
y_pre= kmeans_model. labels_
y_pre
r1= pd. Series( kmeans_model. labels_) . value_counts( )
r1
cluster_center= pd. DataFrame( kmeans_model. cluster_centers_ , columns= [ 'ZL' , 'ZR' , 'ZF' , 'ZM' , 'ZC' ] )
cluster_center. index= pd. DataFrame( kmeans_model. labels_) . drop_duplicates( ) . iloc[ : , 0 ]
cluster_center
labels = [ 'ZL' , 'ZR' , 'ZF' , 'ZM' , 'ZC' ]
legen = [ '客户群' + str ( i + 1 ) for i in cluster_center. index]
lstype = [ '-' , '--' , ( 0 , ( 3 , 5 , 1 , 5 , 1 , 5 ) ) , ':' , '-.' ]
kinds = list ( cluster_center. iloc[ : , 0 ] )
cluster_center= pd. concat( [ cluster_center, cluster_center[ [ 'ZL' ] ] ] , axis= 1 )
centers= np. array( cluster_center. iloc[ : , 0 : ] )
n = len ( labels)
angles = np. linspace( 0 , 2 * np. pi, 6 , endpoint = True )
angles
ax = plt. subplot( 111 , polar = True )
style= [ 'ro--' , 'bo--' , 'yo--' , 'go--' , 'ko--' ]
c = [ 'class1' , 'class2' , 'class3' , 'class4' , 'class5' ]
for i in range ( 5 ) :
ax. plot( angles, centers[ i] , style[ i] , label = c[ i] )
ax. set_thetagrids( angles * 180 / np. pi, [ 'ZL' , 'ZR' , 'ZF' , 'ZM' , 'ZC' ] )
plt. legend( loc= 'lower right' , bbox_to_anchor= ( 1.5 , 0.0 ) )


 1550
1550


 被折叠的 条评论
为什么被折叠?
被折叠的 条评论
为什么被折叠?
 到【灌水乐园】发言


