


1. 命令介绍:
-
sar(System ActivityReporter系统活动情况报告)是目前Linux上最为全面的系统性能分析工具之一,可以从多方面对系统的活动进行报告,包括:文件的读写情况、系统调用的使用情况、磁盘I/O、CPU效率、内存使用状况、进程活动及IPC有关的活动等,sar命令有sysstat安装包安装,本文主要以CentOS 7系列x64系统为例,介绍sar命令。
-
格式:
-
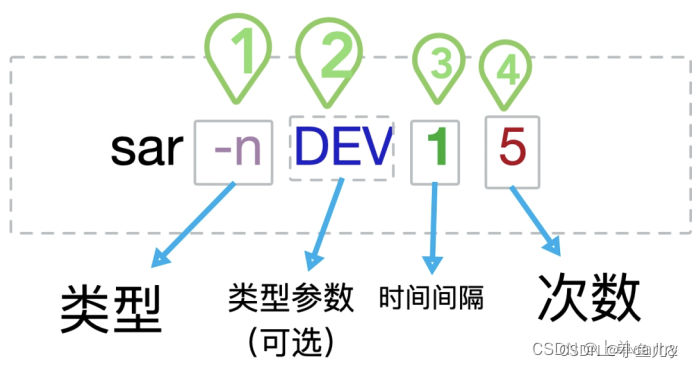
sar命令很简单,它的参数主要分为四部分。其中,第二部分和第三、四部分,是可选的,也就是说,最终要的参数,就剩下一个,那就是选项。不带选项默认是-u。
-
选项,也就是我们要获取的是哪个类型的指标数据,这里的-n,代表的是监控一些网络信息
-
类型参数,有的类型带有参数,有的没有。这里的DEV,代表的是监控网卡信息
-
时间间隔,表示多少秒采样一次数据,这里的1就是1秒
-
次数,表示采样的次数。比如时间间隔是3,采样次数是4,那么sar命令将会阻塞12秒钟
-
Sar的参数众多,想要一个参数一个参数的记忆,不免会耗费大量时间。所以我们就需要一个切入点,讨论监控工具,不外乎就是监控系统资源,那么自然也就是磁盘、cpu、网络、内存、IO等。
默认监控: sar 1 1     //  CPU和IOWAIT统计状态
(1) sar -b 1 1        // IO传送速率
(2) sar -B 1 1        // 页交换速率
(3) sar -c 1 1        // 进程创建的速率
(4) sar -d 1 1        // 块设备的活跃信息
(5) sar -n DEV 1 1    // 网路设备的状态信息
(6) sar -n SOCK 1 1   // SOCK的使用情况
(7) sar -n ALL 1 1    // 所有的网络状态信息
(8) sar -P ALL 1 1    // 每颗CPU的使用状态信息和IOWAIT统计状态
(9) sar -q 1 1        // 队列的长度(等待运行的进程数)和负载的状态
(10) sar -r 1 1      // 内存和swap空间使用情况
(11) sar -R 1 1       // 内存的统计信息(内存页的分配和释放、系统每秒作为BUFFER使用内存页、每秒被cache到的内存页)
(12) sar -u 1 1       // CPU的使用情况和IOWAIT信息(同默认监控)
(13) sar -v 1 1       // inode, file and other kernel tablesd的状态信息
(14) sar -w 1 1       // 每秒上下文交换的数目
(15) sar -W 1 1       // SWAP交换的统计信息(监控状态同iostat 的si so)
(16) sar -x 2906 1 1  // 显示指定进程(2906)的统计信息,信息包括:进程造成的错误、用户级和系统级用户CPU的占用情况、运行在哪颗CPU上
(17) sar -y 1 1       // TTY设备的活动状态
(18) 将结果输出到文件(-o)和读取记录信息(-f)
(19) sar -h           // 查看帮助
2. CPU信息:
- sar -u 1 3 或者 sar 1 3(1:每隔一秒刷新一次,3:刷新3次)
[root@localhost ~]# sar -u 1 3
Linux 3.10.0-1160.el7.x86_64 (localhost.localdomain) 	2022年08月15日 	_x86_64_	(2 CPU)

10时40分42秒     CPU     %user     %nice   %system   %iowait    %steal     %idle
10时40分43秒     all      0.00      0.00      0.00      0.00      0.00    100.00
10时40分44秒     all      0.00      0.00      0.50      0.00      0.00     99.50
10时40分45秒     all      0.00      0.00      0.00      0.00      0.00    100.00
平均时间:     all      0.00      0.00      0.17      0.00      0.00     99.83
- 也可以使用-p查看全天的
[root@localhost ~]# sar -p
Linux 3.10.0-1160.el7.x86_64 (localhost.localdomain) 	2022年08月15日 	_x86_64_	(2 CPU)

10时20分01秒     CPU     %user     %nice   %system   %iowait    %steal     %idle
10时30分01秒     all      0.01      0.00      0.03      0.01      0.00     99.95
10时40分01秒     all      0.01      0.00      0.04      0.01      0.00     99.95
平均时间:     all      0.01      0.00      0.04      0.01      0.00     99.95
| 输出项 | 说明 |
|---|---|
| CPU | all表示统计信息为所有cpu的平均值 |
| %user | 显示在用户级别(application)运行使用CPU总时间的百分比 |
| %nice | 改变过优先级的进程的CPU使用率 |
| %system | 内核空间的CPU使用率,在核心级别(kernel)运行所使用CPU总时间的百分比 |
| %iowait | 显示用于等待I/O操作占用CPU总时间的百分比 |
| %steal | 管理程序(hypervisor)为另一个虚拟进程提供服务而等待虚拟CPU的百分比 |
| %idle | 显示CPU空闲时间占用CPU总时间的百分比 |
- 在以上的显示当中,主要看%iowait和%idle,%iowait过高表示存在I/O瓶颈,即磁盘IO无法满足业务需求,如果%idle过低表示CPU使用率比较严重,需要结合内存使用等情况判断CPU是否瓶颈。
- 进程长度和CPU平均负载状态监控
sar -q 1 3 (1:每隔一秒刷新一次,3:刷新3次)
[root@localhost ~]# sar -q 1 3
Linux 3.10.0-1160.el7.x86_64 (localhost.localdomain) 	2022年08月15日 	_x86_64_	(2 CPU)

10时57分04秒   runq-sz  plist-sz   ldavg-1   ldavg-5  ldavg-15   blocked
10时57分05秒         0       129      0.00      0.01      0.05         0
10时57分06秒         0       129      0.00      0.01      0.05         0
10时57分07秒         0       129      0.00      0.01      0.05         0
平均时间:         0       129      0.00      0.01      0.05         0
| 输出项 | 说明 |
|---|---|
| runq-sz | 运行队列的长度(等待运行的进程数) |
| plist-sz | 进程列表中进程(Processes)和线程(threads)的数量 |
| ldavg-1 | 最后1分钟的CPU平均负载,即将多核CPU过去一分钟的负载相加再除以核心数得出的平均值,5分钟和15分钟以此类推 |
| ldavg-5 | 最后5分钟的CPU平均负载 |
| ldavg-15 | 最后15分钟的CPU平均负载 |
| blocked |
3. 内存监控:
- sar -r 1 3 (1:每隔一秒刷新一次,3:刷3次)
[root@localhost ~]# sar -r 1 3
Linux 3.10.0-1160.el7.x86_64 (localhost.localdomain) 	2022年08月15日 	_x86_64_	(2 CPU)

11时25分11秒 kbmemfree kbmemused  %memused kbbuffers  kbcached  kbcommit   %commit  kbactive   kbinact   kbdirty
11时25分13秒   1260580    767316     37.84      9724    478632    257068      6.23    405636    133204         0
11时25分14秒   1260580    767316     37.84      9724    478632    257068      6.23    405640    133204         0
11时25分15秒   1260580    767316     37.84      9724    478632    257068      6.23    405648    133204         0
平均时间:   1260580    767316     37.84      9724    478632    257068      6.23    405641    133204         0
| 输出项 | 说明 |
|---|---|
| kbmemfree | 这个值和free命令中的free值基本一致,所以它不包括buffer和cache的空间 |
| kbmemused | 这个值和free命令中的userd值基本一致,所以它包括buffer和cache的空间 |
| %memused | 这个值是kbmemused和内存总量(不包括swap)的一个百分比 |
| kbbuffers和kbcached | 这两个值就是free命令中的buffer和cache |
| kbcommit | 保证当前系统所需要的内存,即为了确保不溢出而需要的内存 |
| %commit | 这个值是kbcommit与内存总量(包括swap)的一个百分比。(可以看做内存使用量的百分比) |
4. I/O和传送速率监控与磁盘使用情况
- Sar的I/O和磁盘使用情况是有点重合的
- sar -b 1 3 (1:每隔一秒刷新一次,3:刷新3次)
[root@localhost ~]# sar -b 1 3
Linux 3.10.0-1160.el7.x86_64 (localhost.localdomain) 	2022年08月15日 	_x86_64_	(2 CPU)

14时35分19秒       tps      rtps      wtps   bread/s   bwrtn/s
14时35分20秒      0.00      0.00      0.00      0.00      0.00
14时35分21秒      0.00      0.00      0.00      0.00      0.00
14时35分22秒      0.00      0.00      0.00      0.00      0.00
平均时间:      0.00      0.00      0.00      0.00      0.00
| 输出项 | 说明 |
|---|---|
| tps | 每秒钟物理设备的I/O传输总量 |
| rtps | 每秒钟从物理设备读入的数据总量 |
| wtps | 每秒钟向物理设备写入的数据总量 |
| bread/s | 每秒钟从物理设备读入的数据量,单位为块/s |
| bwrtn/s | 每秒钟向物理设备写入的数据量,单位块/s |
- sar -d 1 3 (1:每隔一秒刷新一次,3:刷新3次)
[root@localhost ~]# sar -d 1 3
Linux 3.10.0-1160.el7.x86_64 (localhost.localdomain) 	2022年08月15日 	_x86_64_	(2 CPU)

14时42分38秒       DEV       tps  rd_sec/s  wr_sec/s  avgrq-sz  avgqu-sz     await     svctm     %util
14时42分39秒   dev11-0      0.00      0.00      0.00      0.00      0.00      0.00      0.00      0.00
14时42分39秒    dev8-0      0.00      0.00      0.00      0.00      0.00      0.00      0.00      0.00

14时42分39秒       DEV       tps  rd_sec/s  wr_sec/s  avgrq-sz  avgqu-sz     await     svctm     %util
14时42分40秒   dev11-0      0.00      0.00      0.00      0.00      0.00      0.00      0.00      0.00
14时42分40秒    dev8-0      0.00      0.00      0.00      0.00      0.00      0.00      0.00      0.00

14时42分40秒       DEV       tps  rd_sec/s  wr_sec/s  avgrq-sz  avgqu-sz     await     svctm     %util
14时42分41秒   dev11-0      0.00      0.00      0.00      0.00      0.00      0.00      0.00      0.00
14时42分41秒    dev8-0      0.00      0.00      0.00      0.00      0.00      0.00      0.00      0.00

平均时间:       DEV       tps  rd_sec/s  wr_sec/s  avgrq-sz  avgqu-sz     await     svctm     %util
平均时间:   dev11-0      0.00      0.00      0.00      0.00      0.00      0.00      0.00      0.00
平均时间:    dev8-0      0.00      0.00      0.00      0.00      0.00      0.00      0.00      0.00
- sar -d 1 3 -p(1:每隔一秒刷新一次,3:刷新3次)
[root@localhost ~]# sar -d 1 3 -p
Linux 3.10.0-1160.el7.x86_64 (localhost.localdomain) 	2022年08月15日 	_x86_64_	(2 CPU)

14时43分57秒       DEV       tps  rd_sec/s  wr_sec/s  avgrq-sz  avgqu-sz     await     svctm     %util
14时43分58秒       sr0      0.00      0.00      0.00      0.00      0.00      0.00      0.00      0.00
14时43分58秒       sda      0.00      0.00      0.00      0.00      0.00      0.00      0.00      0.00

14时43分58秒       DEV       tps  rd_sec/s  wr_sec/s  avgrq-sz  avgqu-sz     await     svctm     %util
14时43分59秒       sr0      0.00      0.00      0.00      0.00      0.00      0.00      0.00      0.00
14时43分59秒       sda      0.00      0.00      0.00      0.00      0.00      0.00      0.00      0.00

14时43分59秒       DEV       tps  rd_sec/s  wr_sec/s  avgrq-sz  avgqu-sz     await     svctm     %util
14时44分00秒       sr0      0.00      0.00      0.00      0.00      0.00      0.00      0.00      0.00
14时44分00秒       sda      0.00      0.00      0.00      0.00      0.00      0.00      0.00      0.00

平均时间:       DEV       tps  rd_sec/s  wr_sec/s  avgrq-sz  avgqu-sz     await     svctm     %util
平均时间:       sr0      0.00      0.00      0.00      0.00      0.00      0.00      0.00      0.00
平均时间:       sda      0.00      0.00      0.00      0.00      0.00      0.00      0.00      0.00
- 参数-p可以打印出sda,hdc等磁盘设备名称,如果不用参数-p,设备节点则有可能是dev8-0,dev22-0
| 输出项 | 说明 |
|---|---|
| tps | 每秒从物理磁盘I/O的次数,多个逻辑请求会被合并为一个I/O磁盘请求,一次传输的大小是不确定的。 |
| rd_sec/s | 每秒读扇区的次数 |
| wr_sec/s | 每秒写扇区的次数 |
| avgrq-sz | 平均每次设备I/O操作的数据大小(扇区) |
| avgqu-sz | 磁盘请求队列的平均长度 |
| await | 从请求磁盘操作到系统完成处理,每次请求的平均消耗时间,包括请求队列等待时间,单位是毫秒(1秒=1000毫秒) |
| svctm | 系统处理每次请求的平均时间,不包括在请求队列中消耗的时间 |
| %util | I/O请求占CPU的百分比,比率越大,说明越饱和 |
- avgqu-sz 的值较低时,设备的利用率较高。
- %util I/O请求占用的CPU百分比,值越高,说明I/O越慢。
5. 网络带宽监控
- sar -n DEV 1 3
- sar命令使用-n选项可以汇报网络相关信息,可用的参数包括:DEV、EDEV、SOCK和FULL。
[root@localhost ~]# sar -n DEV 1 3
Linux 3.10.0-1160.el7.x86_64 (localhost.localdomain) 	2022年08月15日 	_x86_64_	(2 CPU)

15时28分59秒     IFACE   rxpck/s   txpck/s    rxkB/s    txkB/s   rxcmp/s   txcmp/s  rxmcst/s
15时29分00秒        lo      0.00      0.00      0.00      0.00      0.00      0.00      0.00
15时29分00秒     ens33      1.00      1.00      0.06      0.19      0.00      0.00      0.00

15时29分00秒     IFACE   rxpck/s   txpck/s    rxkB/s    txkB/s   rxcmp/s   txcmp/s  rxmcst/s
15时29分01秒        lo      0.00      0.00      0.00      0.00      0.00      0.00      0.00
15时29分01秒     ens33      1.00      2.00      0.06      0.48      0.00      0.00      0.00

15时29分01秒     IFACE   rxpck/s   txpck/s    rxkB/s    txkB/s   rxcmp/s   txcmp/s  rxmcst/s
15时29分02秒        lo      0.00      0.00      0.00      0.00      0.00      0.00      0.00
15时29分02秒     ens33      1.00      1.00      0.06      0.40      0.00      0.00      0.00

平均时间:     IFACE   rxpck/s   txpck/s    rxkB/s    txkB/s   rxcmp/s   txcmp/s  rxmcst/s
平均时间:        lo      0.00      0.00      0.00      0.00      0.00      0.00      0.00
平均时间:     ens33      1.00      1.33      0.06      0.36      0.00      0.00      0.00
| 输出项 | 说明 |
|---|---|
| IFACE | 网络设备的名称 |
| rxpck/s | 每秒钟接收到的包数目 |
| txpck/s | 每秒钟发送出去的包数目 |
| rxbyt/s | 每秒钟接收到的字节数 |
| txbyt/s | 每秒钟发送出去的字节数 |
| rxcmp/s | 每秒钟接收到的压缩包数目 |
| txcmp/s | 每秒钟发送出去的压缩包数目 |
| txmcst/s | 每秒钟接收到的多播包的包数目 |
- 查看网络信息的参数还有很多,就不一一举例,毕竟大多数时候我们只和DEV打交道,这边我就把它举出来了。
1.DEV 网卡
2.EDEV 网卡 (错误)
3.NFS NFS 客户端
4.NFSD NFS 服务器
5.SOCK Sockets (套接字) (v4)
6.IP IP 流 (v4)
7.EIP IP 流 (v4) (错误)
8.ICMP ICMP 流 (v4)
9.EICMP ICMP 流 (v4) (错误)
10.TCP TCP 流 (v4)
11.ETCP TCP 流 (v4) (错误)
12.UDP UDP 流 (v4)
13.SOCK6 Sockets (套接字) (v6)
14.IP6 IP 流 (v6)
15.EIP6 IP 流 (v6) (错误)
16.ICMP6 ICMP 流 (v6)
17.EICMP6 ICMP 流 (v6) (错误)
18.UDP6 UDP 流 (v6)
6. 一些可能会用到的选项
- 将结果输出到文件(-o)和读取记录信息(-f)
[root@localhost ~]# sar -u 1 3 -o test
Linux 3.10.0-1160.el7.x86_64 (localhost.localdomain) 	2022年08月15日 	_x86_64_	(2 CPU)

15时38分17秒     CPU     %user     %nice   %system   %iowait    %steal     %idle
15时38分18秒     all      0.00      0.00      0.50      0.00      0.00     99.50
15时38分19秒     all      0.00      0.00      0.00      0.00      0.00    100.00
15时38分20秒     all      0.00      0.00      0.00      0.00      0.00    100.00
平均时间:     all      0.00      0.00      0.17      0.00      0.00     99.83
- -f可以读取二级制存储的数据文件,所以我们也可以用它来读取之前的日志文件中的系统数据
[root@localhost ~]# sar -f /var/log/sa/sa15
Linux 3.10.0-1160.el7.x86_64 (localhost.localdomain) 	2022年08月15日 	_x86_64_	(2 CPU)

10时20分01秒     CPU     %user     %nice   %system   %iowait    %steal     %idle
10时30分01秒     all      0.01      0.00      0.03      0.01      0.00     99.95
10时40分01秒     all      0.01      0.00      0.04      0.01      0.00     99.95
10时50分01秒     all      0.01      0.00      0.03      0.01      0.00     99.96
11时00分01秒     all      0.00      0.00      0.03      0.01      0.00     99.96
11时10分01秒     all      0.00      0.00      0.03      0.01      0.00     99.96
11时20分01秒     all      0.00      0.00      0.03      0.01      0.00     99.95
11时30分01秒     all      0.01      0.00      0.03      0.01      0.00     99.96
11时40分01秒     all      0.00      0.00      0.03      0.01      0.00     99.96
11时50分01秒     all      0.00      0.00      0.03      0.01      0.00     99.96
12时00分01秒     all      0.00      0.00      0.02      0.01      0.00     99.97
12时10分01秒     all      0.00      0.00      0.03      0.01      0.00     99.96
12时20分01秒     all      0.00      0.00      0.03      0.01      0.00     99.96
12时30分01秒     all      0.00      0.00      0.03      0.01      0.00     99.96
12时40分01秒     all      0.00      0.00      0.03      0.01      0.00     99.96
12时50分01秒     all      0.00      0.00      0.03      0.01      0.00     99.96
13时00分01秒     all      0.00      0.00      0.03      0.01      0.00     99.96
13时10分01秒     all      0.00      0.00      0.03      0.01      0.00     99.96
13时20分01秒     all      0.00      0.00      0.03      0.01      0.00     99.96
13时30分01秒     all      0.00      0.00      0.03      0.01      0.00     99.96
13时40分01秒     all      0.00      0.00      0.03      0.01      0.00     99.96
13时50分01秒     all      0.00      0.00      0.03      0.01      0.00     99.96
14时00分01秒     all      0.00      0.00      0.03      0.01      0.00     99.96
14时10分01秒     all      0.00      0.00      0.03      0.01      0.00     99.95
14时20分01秒     all      0.00      0.00      0.03      0.01      0.00     99.97
14时30分01秒     all      0.00      0.00      0.03      0.01      0.00     99.96
14时40分01秒     all      0.01      0.00      0.03      0.01      0.00     99.96
14时50分01秒     all      0.01      0.00      0.04      0.01      0.00     99.95
15时00分01秒     all      0.00      0.00      0.03      0.01      0.00     99.96
15时10分01秒     all      0.00      0.00      0.03      0.01      0.00     99.96

15时10分01秒     CPU     %user     %nice   %system   %iowait    %steal     %idle
15时20分01秒     all      0.01      0.00      0.03      0.00      0.00     99.96
15时30分01秒     all      0.01      0.00      0.03      0.01      0.00     99.96
平均时间:     all      0.00      0.00      0.03      0.01      0.00     99.96
- 监控indo、文件和其他内核监控
- sar -v 1 3
[root@localhost ~]# sar -v 1 3
Linux 3.10.0-1160.el7.x86_64 (localhost.localdomain) 	2022年08月15日 	_x86_64_	(2 CPU)

15时41分08秒 dentunusd   file-nr  inode-nr    pty-nr
15时41分09秒     28179      1376     36475         1
15时41分10秒     28179      1376     36475         1
15时41分11秒     28179      1376     36475         1
平均时间:     28179      1376     36475         1
| 输出项 | 说明 |
|---|---|
| dentunusd | 目录高速缓存中未被使用的条目数量 |
| file-nr | 文件句柄(file handle)的使用数量 |
| inode-nr | 索引节点句柄(inode handle)的使用数量 |
| pty-nr | 使用的pty数量 |
- 内存分页监控
- sar -B 1 3
[root@localhost ~]# sar -B 1 3
Linux 3.10.0-1160.el7.x86_64 (localhost.localdomain) 	2022年08月15日 	_x86_64_	(2 CPU)

15时48分19秒  pgpgin/s pgpgout/s   fault/s  majflt/s  pgfree/s pgscank/s pgscand/s pgsteal/s    %vmeff
15时48分20秒      0.00      0.00     63.37      0.00     63.37      0.00      0.00      0.00      0.00
15时48分21秒      0.00      0.00     31.00      0.00     56.00      0.00      0.00      0.00      0.00
15时48分22秒      0.00      0.00     19.00      0.00     24.00      0.00      0.00      0.00      0.00
平均时间:      0.00      0.00     37.87      0.00     47.84      0.00      0.00      0.00      0.00
| 输出项 | 说明 |
|---|---|
| pgpgin/s | 表示每秒从磁盘或SWAP置换到内存的字节数(KB) |
| pgpgout/s | 表示每秒从内存置换到磁盘或SWAP的字节数(KB) |
| fault/s | 每秒钟系统产生的缺页数,即主缺页与次缺页之和(major + minor) |
| majflt/s | 每秒钟产生的主缺页数 |
| pgfree/s | 每秒被放入空闲队列中的页个数 |
| pgscank/s | 每秒被kswapd扫描的页个数 |
| pgscand/s | 每秒直接被扫描的页个数 |
| pgsteal/s | 每秒钟从cache中被清除来满足内存需要的页个数 |
| %vmeff | 每秒清除的页(pgsteal)占总扫描页(pgscank+pgscand)的百分比 |
要判断系统瓶颈问题,有时需几个 sar 命令选项结合起来
怀疑CPU存在瓶颈,可用 sar -u 和 sar -q 等来查看
怀疑内存存在瓶颈,可用 sar -B、sar -r 和 sar -W 等来查看
怀疑I/O存在瓶颈,可用 sar -b、sar -u 和 sar -d 等来查看
7. 压力测试
- 测试cpu占用率
- 测试前数据
[root@localhost ~]# sar -u 1 3
Linux 3.10.0-1160.el7.x86_64 (localhost.localdomain) 	2022年08月15日 	_x86_64_	(2 CPU)

16时04分56秒     CPU     %user     %nice   %system   %iowait    %steal     %idle
16时04分57秒     all      0.00      0.00      0.50      0.00      0.00     99.50
16时04分58秒     all      0.00      0.00      0.00      0.00      0.00    100.00
16时04分59秒     all      0.00      0.00      0.00      0.00      0.00    100.00
平均时间:     all      0.00      0.00      0.17      0.00      0.00     99.83
- 这里我们用stress命令测试
- 注意这条命令没有可以执行下面操作:
- yum install -y epel-release
- yum intsall -y stress
[root@localhost yum.repos.d]# stress  --io 15 --hdd 15 --timeout 600
stress: info: [8014] dispatching hogs: 0 cpu, 15 io, 0 vm, 15 hdd
- 这里可以看到我们的cpu空闲时间已经没有了
[root@localhost ~]# sar  -u 1 3
Linux 3.10.0-1160.el7.x86_64 (localhost.localdomain) 	2022年08月15日 	_x86_64_	(2 CPU)

16时24分58秒     CPU     %user     %nice   %system   %iowait    %steal     %idle
16时24分59秒     all      0.53      0.00     86.70     12.77      0.00      0.00
16时25分00秒     all      0.00      0.00     84.57     15.43      0.00      0.00
16时25分01秒     all      0.53      0.00     92.06      7.41      0.00      0.00
平均时间:     all      0.35      0.00     87.79     11.86      0.00      0.00
- 测试内存占有率
[root@localhost ~]# sar -r 1 3
Linux 3.10.0-1160.el7.x86_64 (localhost.localdomain) 	2022年08月15日 	_x86_64_	(2 CPU)

16时26分37秒 kbmemfree kbmemused  %memused kbbuffers  kbcached  kbcommit   %commit  kbactive   kbinact   kbdirty
16时26分38秒     73004   1954892     96.40       816   1662316    280916      6.81    342944   1389428    405624
16时26分39秒     69540   1958356     96.57       816   1664496    280916      6.81    345060   1389452    389136
16时26分40秒     72684   1955212     96.42       816   1659824    280916      6.81    347588   1382160    404344
平均时间:     71743   1956153     96.46       816   1662212    280916      6.81    345197   1387013    399701
- 我们依旧是使用stress命令测试
- stress --vm 2 --vm-bytes 1G --vm-hang 100 --timeout 100s
- 开启2个进程分配内存,每次分配1GB内存,保持100秒后释放,100秒后退出。
[root@localhost yum.repos.d]# stress --vm 2 --vm-bytes 1G --vm-hang 1000 --timeout 100s
stress: info: [8185] dispatching hogs: 0 cpu, 0 io, 2 vm, 0 hdd
[root@localhost ~]# sar -r 1 3
Linux 3.10.0-1160.el7.x86_64 (localhost.localdomain) 	2022年08月15日 	_x86_64_	(2 CPU)

17时00分52秒 kbmemfree kbmemused  %memused kbbuffers  kbcached  kbcommit   %commit  kbactive   kbinact   kbdirty
17时00分53秒     65448   1962448     96.77        64     29464   2358380     57.17   1331208    472044         4
17时00分54秒     65448   1962448     96.77        64     29464   2358380     57.17   1331216    472056         4
17时00分55秒     65448   1962448     96.77        64     29464   2358380     57.17   1331216    472056         4
平均时间:     65448   1962448     96.77        64     29464   2358380     57.17   1331213    472052         4
- 测试I/O与传输速率与磁盘使用情况
[root@localhost ~]# sar -b 1 3
Linux 3.10.0-1160.el7.x86_64 (localhost.localdomain) 	2022年08月15日 	_x86_64_	(2 CPU)

17时02分22秒       tps      rtps      wtps   bread/s   bwrtn/s
17时02分23秒     19.00     19.00      0.00    288.00      0.00
17时02分24秒      2.00      2.00      0.00     40.00      0.00
17时02分25秒      0.00      0.00      0.00      0.00      0.00
平均时间:      7.00      7.00      0.00    109.33      0.00
- 依旧是stress命令测试
[root@localhost yum.repos.d]# stress --io 15 --hdd 15 --timeout  600
stress: info: [8209] dispatching hogs: 0 cpu, 15 io, 0 vm, 15 hdd
- 我们用stress命令模拟写入数据,可以看到此时的IO总数和写入速率
[root@localhost ~]# sar -b 1 3
Linux 3.10.0-1160.el7.x86_64 (localhost.localdomain) 	2022年08月15日 	_x86_64_	(2 CPU)

17时04分20秒       tps      rtps      wtps   bread/s   bwrtn/s
17时04分21秒   1121.00      0.00   1121.00      0.00 1142448.00
17时04分22秒   1218.00      0.00   1218.00      0.00 1237760.00
17时04分23秒    999.00      0.00    999.00      0.00 1017104.00
平均时间:   1112.67      0.00   1112.67      0.00 1132437.33
- 也可以用-d -p看的更加全面
[root@localhost ~]# sar -d 1 3 -p
Linux 3.10.0-1160.el7.x86_64 (localhost.localdomain) 	2022年08月15日 	_x86_64_	(2 CPU)

17时05分29秒       DEV       tps  rd_sec/s  wr_sec/s  avgrq-sz  avgqu-sz     await     svctm     %util
17时05分30秒       sr0      0.00      0.00      0.00      0.00      0.00      0.00      0.00      0.00
17时05分30秒       sda   1254.46      0.00 1277462.38   1018.34      0.90      0.72      0.68     85.35

17时05分30秒       DEV       tps  rd_sec/s  wr_sec/s  avgrq-sz  avgqu-sz     await     svctm     %util
17时05分31秒       sr0      0.00      0.00      0.00      0.00      0.00      0.00      0.00      0.00
17时05分31秒       sda   1297.00      0.00 1305220.00   1006.34      0.94      0.72      0.68     88.60

17时05分31秒       DEV       tps  rd_sec/s  wr_sec/s  avgrq-sz  avgqu-sz     await     svctm     %util
17时05分32秒       sr0      0.00      0.00      0.00      0.00      0.00      0.00      0.00      0.00
17时05分32秒       sda   1039.00      0.00 1055016.00   1015.41      0.88      0.85      0.81     83.80

平均时间:       DEV       tps  rd_sec/s  wr_sec/s  avgrq-sz  avgqu-sz     await     svctm     %util
平均时间:       sr0      0.00      0.00      0.00      0.00      0.00      0.00      0.00      0.00
平均时间:       sda   1197.01      0.00 1212781.73   1013.18      0.91      0.76      0.72     85.91


 2523
2523


 被折叠的 条评论
为什么被折叠?
被折叠的 条评论
为什么被折叠?
 到【灌水乐园】发言


