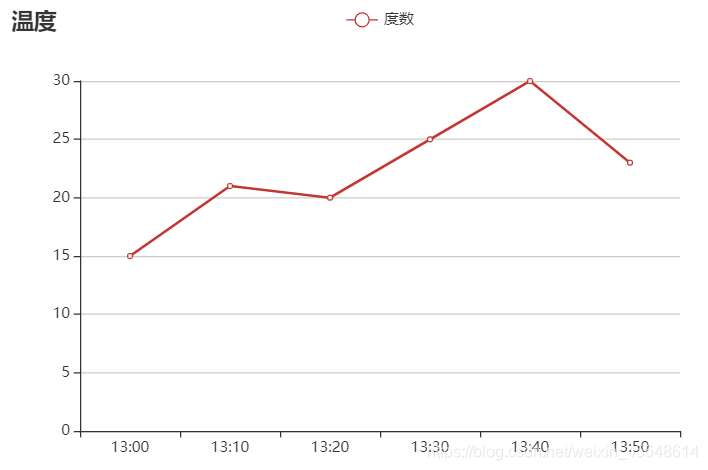
1、折线图
<!DOCTYPE html>
<html lang="en">
<head>
<meta charset="UTF-8">
<meta name="viewport" content="width=device-width, initial-scale=1.0">
<title>ECharts图表折线图实例</title>
<!--引入echarts.min.js文件-->
<script src="echarts.min.js"></script>
</head>
<body>
<!--创建容器-->
<div id="main" style="width: 600px;height: 400px;"></div>
</body>
<script>
var myChart = echarts.init(document.getElementById('main'));
var option = {
title: {
text: '温度'
},
tooltip: {
show: true,
trigger: 'axis',
textStyle: {
color: '#fff',
fontSize: 20
}
},
grid: {},
legend: {
data: ['度数']
},
xAxis: {
data: ["13:00", "13:10", "13:20", "13:30", "13:40", "13:50"]
},
yAxis: {},
series: [{
name: '度数',
type: 'line',
data: [15, 21, 20, 25, 30, 23]
}]
};
myChart.setOption(option);
</script>
</html>
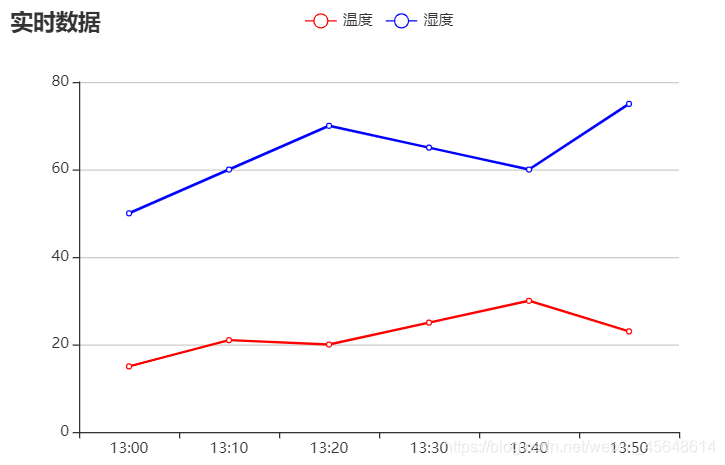
2、多线折线图
<!DOCTYPE html>
<html lang="en">
<head>
<meta charset="UTF-8">
<meta name="viewport" content="width=device-width, initial-scale=1.0">
<title>ECharts图表多线折线图实例</title>
<!--引入echarts.min.js文件-->
<script src="echarts.min.js"></script>
</head>
<body>
<!--创建容器-->
<div id="main" style="width: 600px;height: 400px;"></div>
</body>
<script>
var myChart = echarts.init(document.getElementById('main'));
var option = {
title: {
text: '实时数据'
},
tooltip: {
show: true,
trigger: 'axis',
textStyle: {
color: '#fff',
fontSize: 20
}
},
grid: {},
legend: {
data: ['温度', '湿度']
},
xAxis: {
data: ["13:00", "13:10", "13:20", "13:30", "13:40", "13:50"]
},
yAxis: {},
series: [{
name: '温度',
type: 'line',
color: ['red'],
data: [15, 21, 20, 25, 30, 23]
}, {
name: '湿度',
type: 'line',
color: ['blue'],
data: [50, 60, 70, 65, 60, 75]
}]
};
myChart.setOption(option);
</script>
</html>
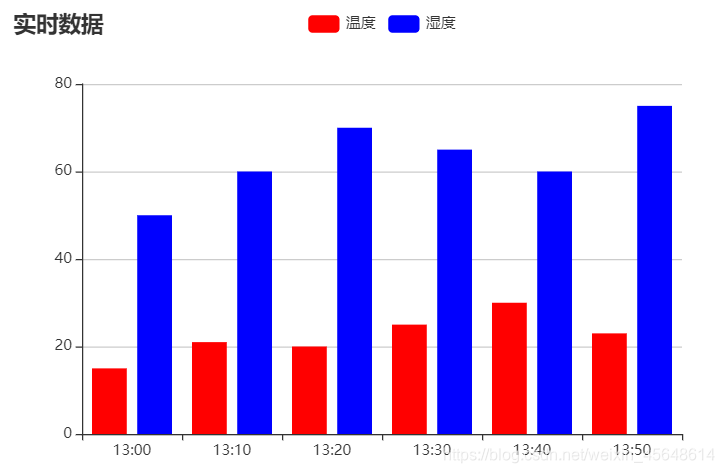
3、柱状图
<!DOCTYPE html>
<html lang="en">
<head>
<meta charset="UTF-8">
<meta name="viewport" content="width=device-width, initial-scale=1.0">
<title>ECharts图表柱状图实例</title>
<!--引入echarts.min.js文件-->
<script src="echarts.min.js"></script>
</head>
<body>
<!--创建容器-->
<div id="main" style="width: 600px;height: 400px;"></div>
</body>
<script>
var myChart = echarts.init(document.getElementById('main'));
var option = {
title: {
text: '实时数据'
},
tooltip: {
show: true,
trigger: 'axis',
textStyle: {
color: '#fff',
fontSize: 20
}
},
grid: {},
legend: {
data: ['温度', '湿度']
},
xAxis: {
data: ["13:00", "13:10", "13:20", "13:30", "13:40", "13:50"]
},
yAxis: {},
series: [{
name: '温度',
type: 'bar',
color: ['red'],
data: [15, 21, 20, 25, 30, 23]
}, {
name: '湿度',
type: 'bar',
color: ['blue'],
data: [50, 60, 70, 65, 60, 75]
}]
};
myChart.setOption(option);
</script>
</html>
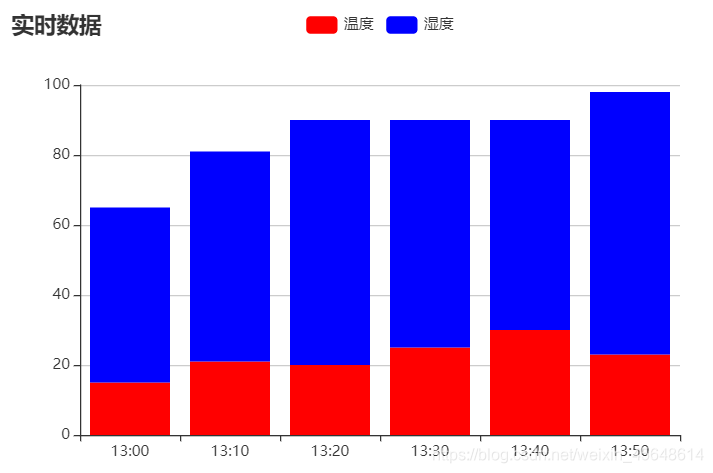
4、堆叠柱状图
<!DOCTYPE html>
<html lang="en">
<head>
<meta charset="UTF-8">
<meta name="viewport" content="width=device-width, initial-scale=1.0">
<title>ECharts图表堆叠柱状图实例</title>
<!--引入echarts.min.js文件-->
<script src="echarts.min.js"></script>
</head>
<body>
<!--创建容器-->
<div id="main" style="width: 600px;height: 400px;"></div>
</body>
<script>
var myChart = echarts.init(document.getElementById('main'));
var option = {
title: {
text: '实时数据'
},
tooltip: {
show: true,
trigger: 'axis',
textStyle: {
color: '#fff',
fontSize: 20
}
},
grid: {},
legend: {
data: ['温度', '湿度']
},
xAxis: {
data: ["13:00", "13:10", "13:20", "13:30", "13:40", "13:50"]
},
yAxis: {},
series: [{
name: '温度',
type: 'bar',
stack: '环境',
color: ['red'],
data: [15, 21, 20, 25, 30, 23]
}, {
name: '湿度',
type: 'bar',
stack: '环境',
color: ['blue'],
data: [50, 60, 70, 65, 60, 75]
}]
};
myChart.setOption(option);
</script>
</html>
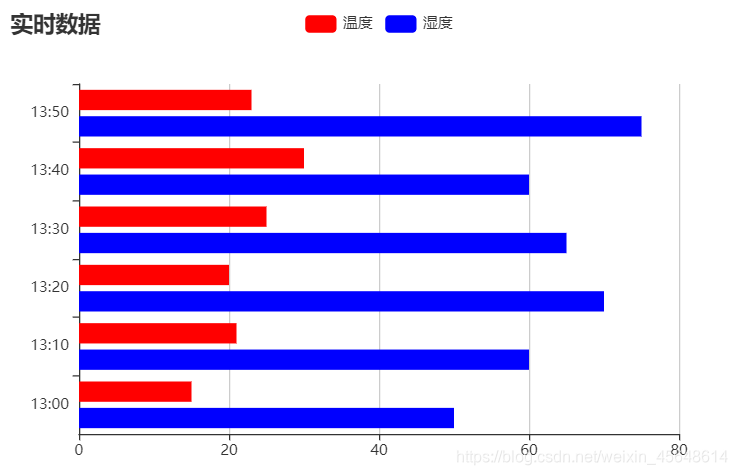
5、横向柱状图
<!DOCTYPE html>
<html lang="en">
<head>
<meta charset="UTF-8">
<meta name="viewport" content="width=device-width, initial-scale=1.0">
<title>ECharts图表横向柱状图实例</title>
<!--引入echarts.min.js文件-->
<script src="echarts.min.js"></script>
</head>
<body>
<!--创建容器-->
<div id="main" style="width: 600px;height: 400px;"></div>
</body>
<script>
var myChart = echarts.init(document.getElementById('main'));
var option = {
title: {
text: '实时数据'
},
tooltip: {
show: true,
trigger: 'axis',
textStyle: {
color: '#fff',
fontSize: 20
}
},
grid: {},
legend: {
data: ['温度', '湿度']
},
xAxis: {},
yAxis: {
data: ["13:00", "13:10", "13:20", "13:30", "13:40", "13:50"]
},
series: [{
name: '温度',
type: 'bar',
color: ['red'],
data: [15, 21, 20, 25, 30, 23]
}, {
name: '湿度',
type: 'bar',
color: ['blue'],
data: [50, 60, 70, 65, 60, 75]
}]
};
myChart.setOption(option);
</script>
</html>
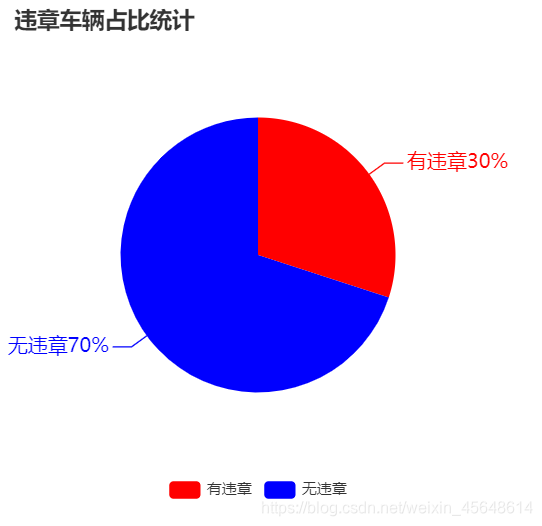
6、饼状图
<!DOCTYPE html>
<html lang="en">
<head>
    <meta charset="UTF-8">
    <meta name="viewport" content="width=device-width, initial-scale=1.0">
    <title>ECharts图表饼状图实例</title>
    <script src="echarts.min.js"></script>
</head>
<body>
    <div id="main" style="width: 400px;height: 400px;"></div>
</body>
<script>
    var mechart = echarts.init(document.querySelector("#main"));
    mechart.setOption({
        title: {
            text: '违章车辆占比统计'
        },
        grid: {},
        legend: {
            data: ['有违章', '无违章'],
            y: 'bottom'
        },
        series: [{
            name: '消息分析',
            type: 'pie',
            radius: '55%',
            label: {
                normal: {
                    show: true,
                    textStyle: {
                        fontWeight: 400,
                        fontSize: 16
                    },
                    formatter: '{b}{d}%'
                }
            },
            data: [{
                name: '有违章',
                value: 30
            }, {
                name: '无违章',
                value: 70
            }],
            color: ['red', 'blue']
        }]
    });
</script>
</html>
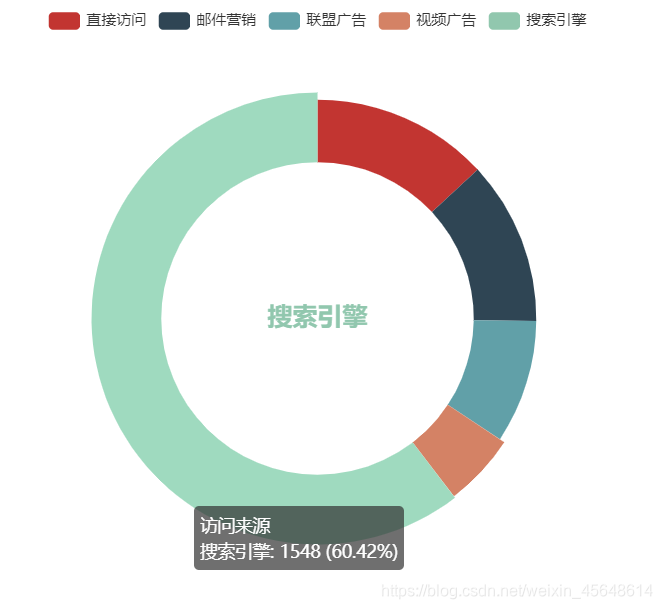
7、环形图
<!DOCTYPE html>
<html lang="en">
<head>
<meta charset="UTF-8">
<meta name="viewport" content="width=device-width, initial-scale=1.0">
<title>ECharts图表环形图实例</title>
<script src="echarts.min.js"></script>
</head>
<body>
<div id="main" style="width: 500px;height: 500px;"></div>
</body>
<script>
var mechart = echarts.init(document.querySelector("#main"));
mechart.setOption({
tooltip: {
trigger: 'item',
formatter: '{a} <br/>{b}: {c} ({d}%)'
},
legend: {
orient: 'horizontal',
data: ['直接访问', '邮件营销', '联盟广告', '视频广告', '搜索引擎']
},
series: [{
name: '访问来源',
type: 'pie',
radius: ['50%', '70%'],
avoidLabelOverlap: false,
label: {
normal: {
show: false,
position: 'center'
},
emphasis: {
show: true,
textStyle: {
fontSize: 20,
fontWeight: 'bold'
}
}
},
labelLine: {
normal: {
show: false
}
},
data: [{
value: 335,
name: '直接访问'
}, {
value: 310,
name: '邮件营销'
}, {
value: 234,
name: '联盟广告'
}, {
value: 135,
name: '视频广告'
}, {
value: 1548,
name: '搜索引擎'
}]
}]
});
</script>
</html>


 155
155

 被折叠的 条评论
为什么被折叠?
被折叠的 条评论
为什么被折叠?
 到【灌水乐园】发言


