


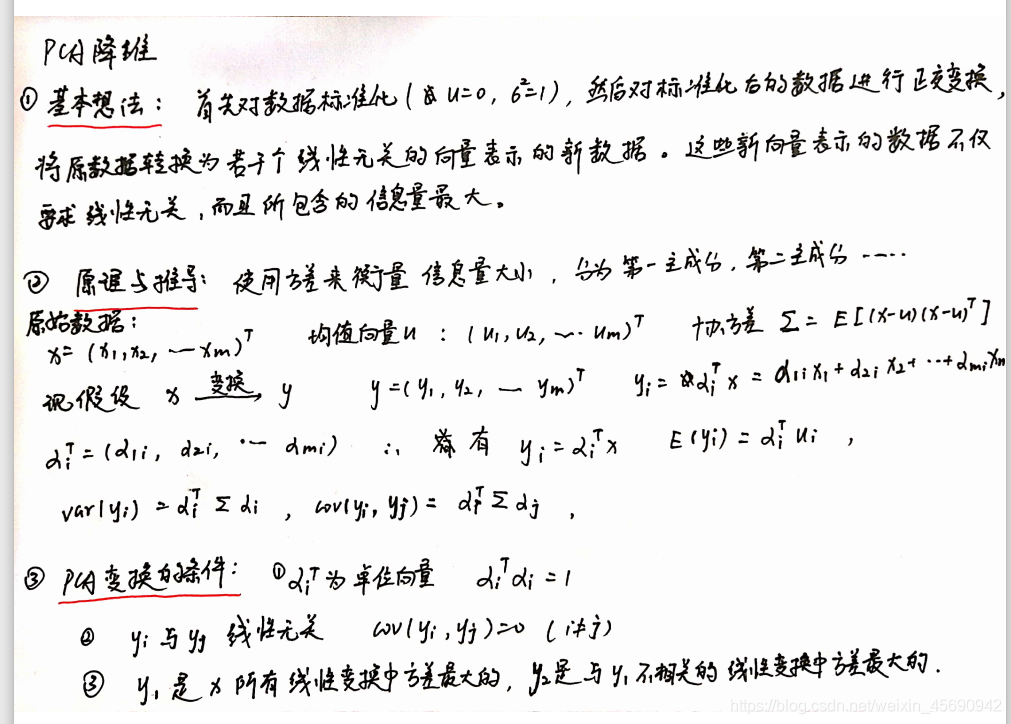
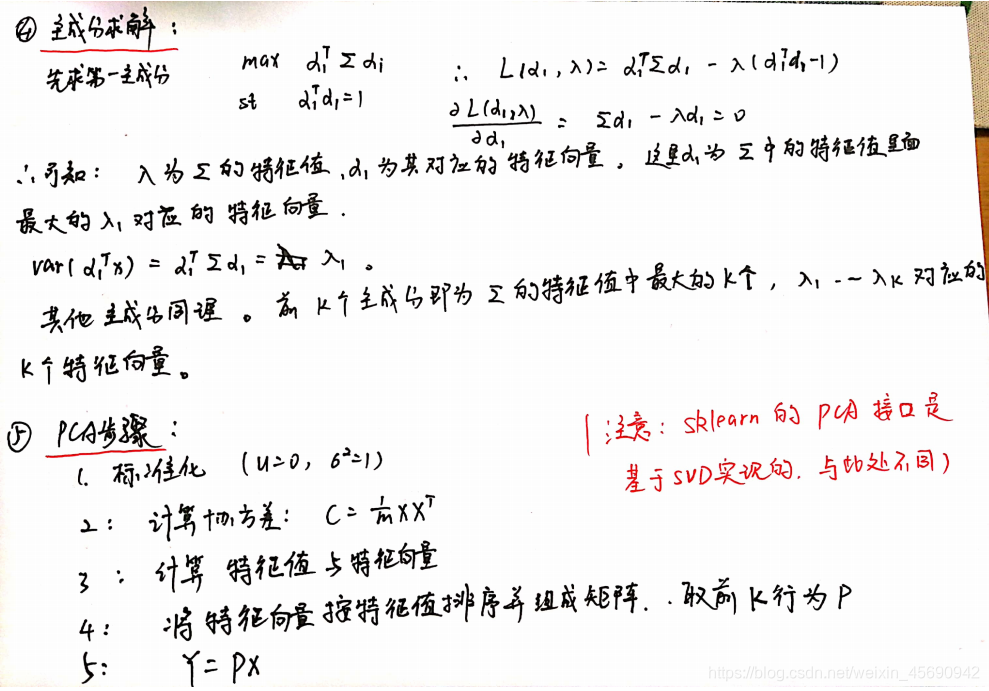
手写实现PCA降维。
 代码如下:
代码如下:
# -*- coding: utf-8 -*-
"""
Created on Thu Jun 25 11:09:09 2020

@author: Lenovo
"""

import numpy as np

class PCA():
    # 计算协方差矩阵
    def calculate_covariance_matrix(self, X):
        m = X.shape[0]
        # 数据标准化
        X = X - np.mean(X, axis=0)
        return 1 / m * np.matmul(X.T, X)

    def pca(self, X, n_components):
        # 计算协方差矩阵
        covariance_matrix = self.calculate_covariance_matrix(X)
        # 计算协方差矩阵的特征值和对应特征向量
        eigenvalues, eigenvectors = np.linalg.eig(covariance_matrix)
        # np.linalg.eig  是计算特征值和特征向量的函数
        # 对特征值排序
        idx = eigenvalues.argsort()[::-1]
        # 取最大的前n_component组
        eigenvectors = eigenvectors[:, idx]
        #上面这一步的作用就是,根据前面 eigenvalues 的排序结果,把特征向量对应的顺序调换
        eigenvectors = eigenvectors[:, :n_components]

        # Y=PX转换
        return np.matmul(X, eigenvectors)


from sklearn import datasets
import matplotlib.pyplot as plt


# 导入sklearn数据集
data = datasets.load_digits()
X = data.data
y = data.target

# 将数据降维到2个主成分
X_trans = PCA().pca(X, 2)
x1 = X_trans[:, 0]
x2 = X_trans[:, 1]

# 绘图展示
cmap = plt.get_cmap('viridis')
colors = [cmap(i) for i in np.linspace(0, 1, len(np.unique(y)))]

class_distr = []
# 绘制不同类别分别
for i, l in enumerate(np.unique(y)):
    _x1 = x1[y == l]
    _x2 = x2[y == l]
    _y = y[y == l]
    class_distr.append(plt.scatter(_x1, _x2, color=colors[i]))

# 图例
plt.legend(class_distr, y, loc=1)

# 坐标轴
plt.suptitle("PCA Dimensionality Reduction")
plt.title("Digit Dataset")
plt.xlabel('Principal Component 1')
plt.ylabel('Principal Component 2')
plt.show()
参考文献与说明:
公众号“机器学习实验室”的微信推文“数学推导+纯Python实现机器学习算法26:PCA降维”
如若侵权,请联系删除。


 2943
2943


 被折叠的 条评论
为什么被折叠?
被折叠的 条评论
为什么被折叠?
 到【灌水乐园】发言


