


 本文介绍了在目标识别后如何使用MATLAB的text和viscircles函数进行目标区域的坐标标记。text函数用于在数据点上添加文本说明,viscircles则用于绘制圆来标记目标。通过示例代码展示了如何使用这两个函数,并给出了相应的效果图。
在做目标识别后,大家将目标区域的坐标识别出来,需要进行标记。
下面介绍两种标记的方法。
一、text函数
1.1函数说明
text(x,y,txt) 使用由 txt 指定的文本,向当前坐标区中的一个或多个数据点添加文本说明。若要将文本添加到一个点,请将 x 和 y 指定为标量。若要将文本添加到多个点,请将 x 和 y 指定为长度相同的向量。
1.2示例
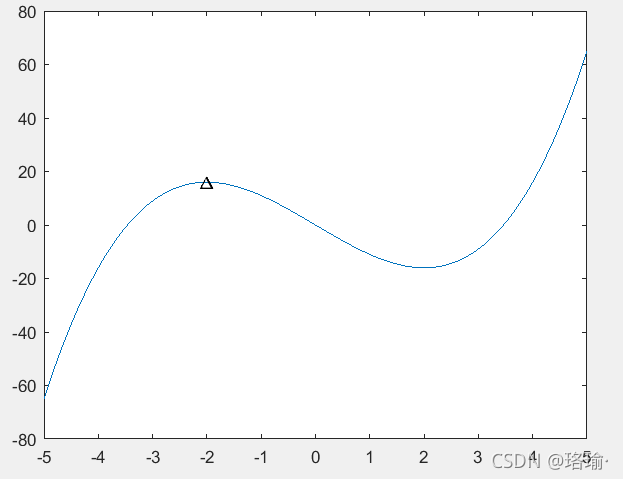
figure();
x = linspace(-5,5);
y = x.^3-12*x;
plot(x,y);
text(-2, 16,'\Delta','Color','black','HorizontalAlignment','center','FontWeight','bold');
1.3效果图
标记点用“三角”表示。
二、viscircles函数
2.1函数说明
在当前坐标区中绘制具有指定 圆心centers 和 半径radii 的圆。
2.2示例
figure
colors = {'b','r','g','y','k'};

for k = 1:5
    % Create 5 random circles to display,
    X = rand(5,1);
    Y = rand(5,1);
    centers = [X Y];
    radii = 0.1*rand(5,1);

    % Clear the axes.
    cla

    % Fix the axis limits.
    xlim([-0.1 1.1])
    ylim([-0.1 1.1])

    % Set the axis aspect ratio to 1:1.
    axis square

    % Set a title.
    title(['k = ' num2str(k)])

    % Display the circles.
    viscircles(centers,radii,'Color',colors{k});

    % Pause for 1 second.
    pause(1)
end
2.3效果图
这里的圆圈,可以自由发挥,括住你标记的目标区域。


 被折叠的 条评论
为什么被折叠?
被折叠的 条评论
为什么被折叠?
 到【灌水乐园】发言


