


1、html 设置图形容器
<div class="content">
<div id="trendAnalysisChart" />
</div>
2、js 绘制图形
mounted() {
// 给window 添加 resize 事件 ,使图形 大小 随窗口变化而变化
window.addEventListener('resize', () => {
const chartDom = document.getElementById('trendAnalysisChart')
const chartTrend = chartDom && echarts.init(chartDom)
chartTrend && chartTrend.resize()
})
this.getTrend()
},
methods: {
getTrend() {
var chartDom = document.getElementById('trendAnalysisChart')
var myChart = echarts.init(chartDom)
var option
option = {
// color: [], 给多个柱子设置颜色
tooltip: { //鼠标划过柱子显示各柱子具体信息---提示框
trigger: 'axis',
axisPointer: {
type: 'shadow'
}
},
legend: {
orient: 'horizontal',
top: '8',
left: '2%', //图例位置
icon: 'rect',
itemWidth: 10,
itemHeight: 10,
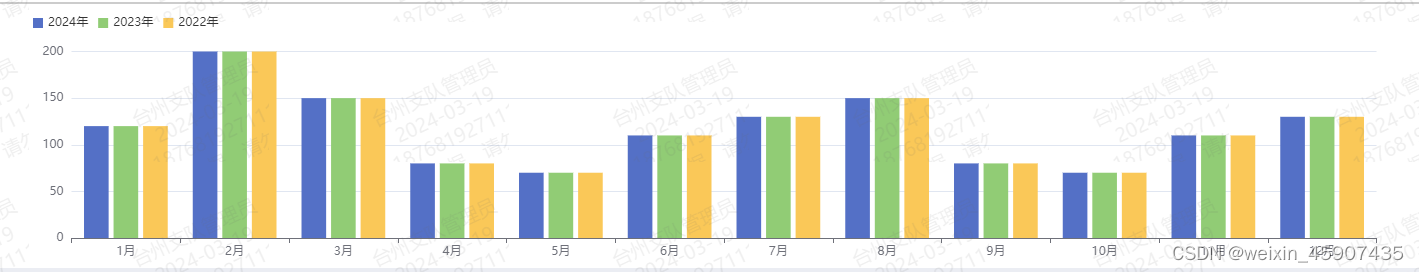
data: ['2024年', '2023年', '2022年'] //多条柱子时此属性一定要设置,对应series中那么,否者不显示图例
},
grid: {
top: '18%', // 设置图表在容器中的位置
left: '5%',
bottom: '30',
right: '5%'
},
xAxis: {
type: 'category',
data: ['1月', '2月', '3月', '4月', '5月', '6月', '7月', '8月', '9月', '10月', '11月', '12月']
},
yAxis: {
type: 'value'
},
series: [
{
name: '2024年',
data: [120, 200, 150, 80, 70, 110, 130, 150, 80, 70, 110, 130],
type: 'bar'
},
{
name: '2023年',
data: [120, 200, 150, 80, 70, 110, 130, 150, 80, 70, 110, 130],
type: 'bar'
},
{
name: '2022年',
data: [120, 200, 150, 80, 70, 110, 130, 150, 80, 70, 110, 130],
type: 'bar'
}
]
}
option && myChart.setOption(option)
}
}
3、css -- 一定要给容器设置大小
.content{
width:100%;
height: 100%;
#trendAnalysisChart{
width:100%;
height: 100%;
}
}
4、效果图


 4284
4284


 被折叠的 条评论
为什么被折叠?
被折叠的 条评论
为什么被折叠?
 到【灌水乐园】发言


