


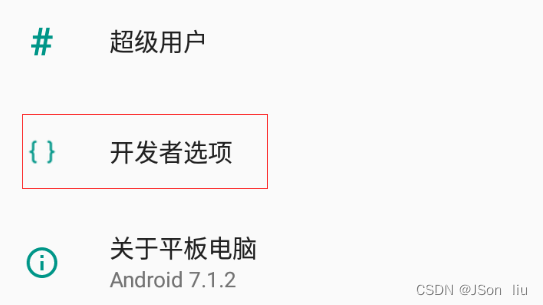
01 专项测试概述
1.专项测试(用户维度)
- 崩溃(Crash,弱网)
- 卡顿(掉帧、GC、CPU)
- 响应慢(启动时间、交互时间、H5加载)
- 发热(cpu、内存、网络、io、gps等硬件使用)
- 掉电快(硬件占用)
- 兼容性问题(平台、手机品牌/型号、回归)
2.专项测试(技术维度)
- 崩溃
- 自动遍历、monkey测试、横竖屏切换、快速进退
- 卡顿(掉帧、gc、cpu)
- 卡顿测试、内存泄漏测试、 method profile
- 响应慢(启动时间、交互响应、H5加载)
- 冷热启动、界面切换、h5性能测试
- 发热(cpu. mem、io、network、gps等硬件使用)
- method profile、gc统计、io统计、流量统计、硬件使用统计、耗电量分析
- 兼容性问题((机型覆盖、回归)
- 兼容性测试、自动化测试、自动遍历、monkey测试
1.1 app启动性能分析
1.1.1app启动流程
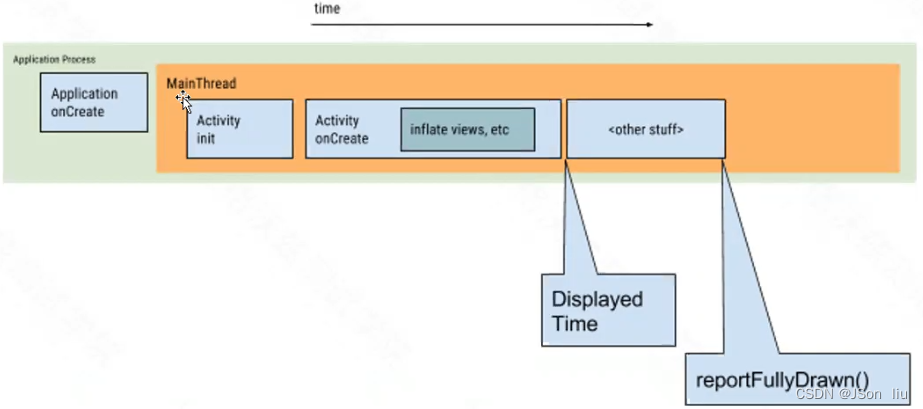
Application OnCreate
- 加载第三方的sdk
Activity OnCreate
- 加载自身的逻辑
- 发送远程数据请求xxx.json
- 渲染界面 List
1.1.2性能启动指标
- 冷启动:5s
- 暖启动:2s
- 热启动:1.5s
- 首屏启动:
1.1.3 app性能分析流程
adb pm && adb am
1.am(activity manager) 使用am去模拟各种系统的行为,例如启动一个activity,强制停止进程,发送广播进程,修改设备屏幕属性等等
adb shell am start -S -W activityName-S:启动前先停止activity-W:等待activity启动完成
startservice [options] <INTENT>: 启动service通过指定的intent参数adb shell am force-stop <PACKAGE>: 强制停止指定的package包应用adb shell am kill [options] <PACKAGE>:杀死指定package包应用进程
2.pm(package manager) 使用pm命令去模拟android行为或者查询设备上的应用等
adb shell pm uninstall com.xxx.android卸载应用abd shell pm list packages [options]查看包名- options:
-s:查看系统package;-3:查看第三方packag-u:查看曾被卸载过的package
- options:
abd shell pm install [options] <PATH>安装应用abd shell pm uninstall [options] <PACKAGE> :卸载命令abd shell pm clear <PACKAGE>清除缓存数据
adb logcat
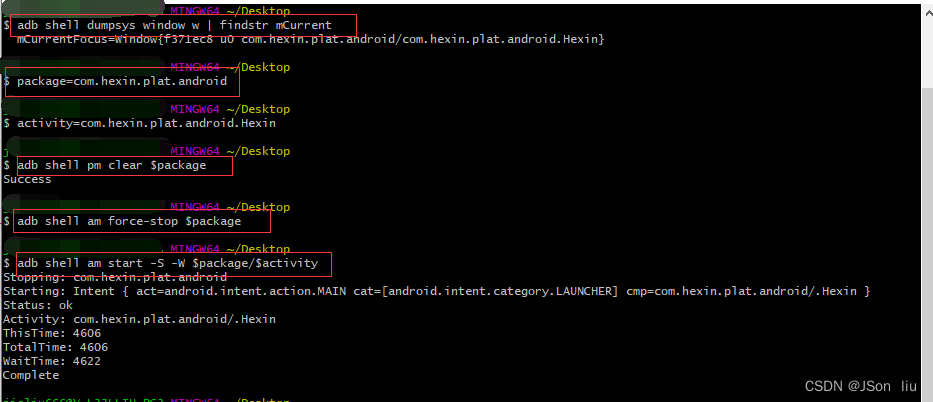
package=com.hexin.plat.android
activity=.AndroidLogoActivity
- 获取activity名:adb shell dumpsys window w | findstr mCurrent
- 清理缓存数据:
adb shell pm clear $package - 停止进程:
adb shell am force-stop $package - 启动app:
adb shell am start -S -W $package/$activity - 获取数据:
adb logcat | findstr -i displayed - adb logcat结果:
- startTime:记录刚准备调用
startActivityAndWait()的时间点 - endTime:记录
startActivityAndWait()函数调用返回的时间点 WaitTime:startActivityAndWait()调用耗时- WaitTime = endTime - startTime
- WaitTime = endTime - startTime
- startTime:记录刚准备调用
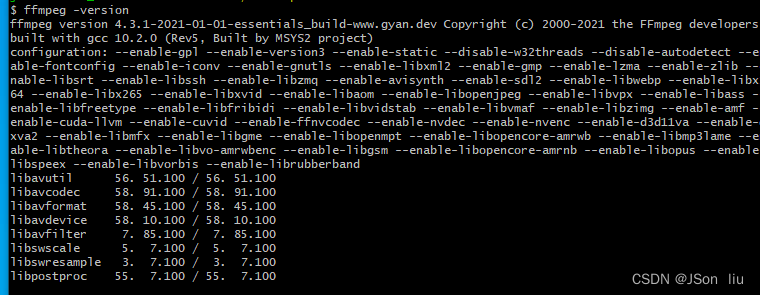
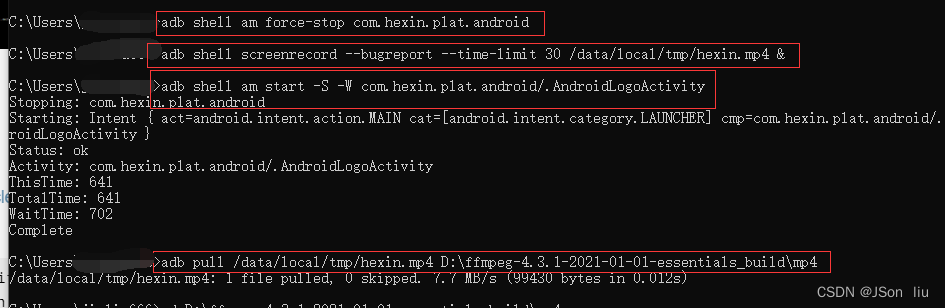
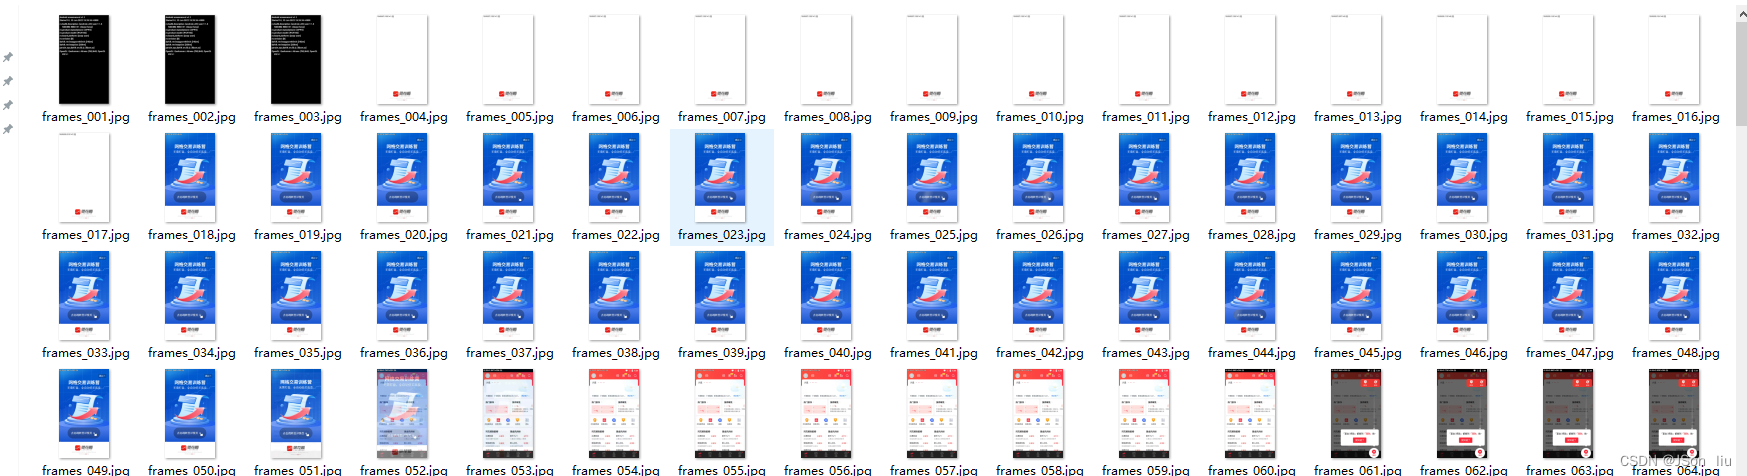
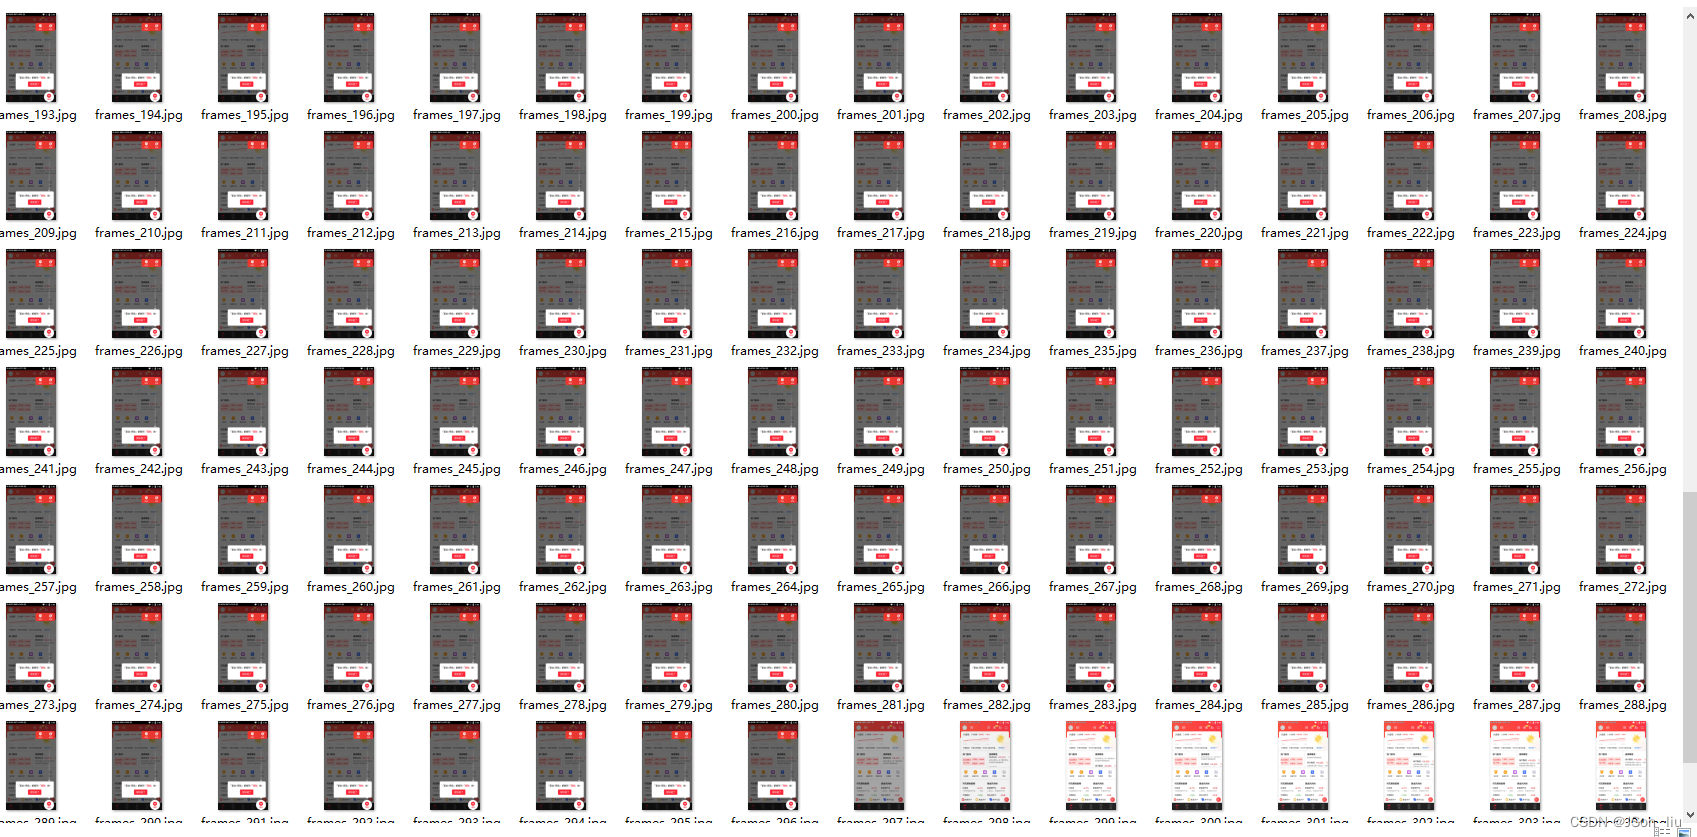
录屏+视频拆帧:ffmpeg工具
下载及安装参考此篇:https://blog.csdn.net/qq_33697094/article/details/112718101
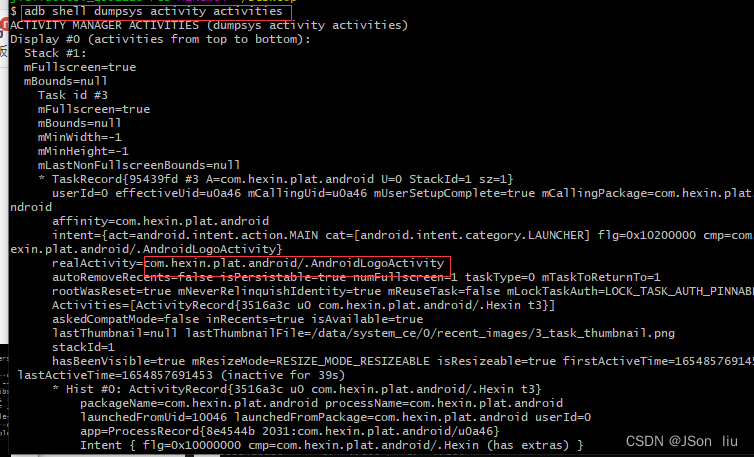
adb shell dumpsys activity activities 查看activity名称
adb shell am force-stop com.hexin.plat.android
adb shell screenrecord --bugreport --time-limit 30 /data/local/tmp/hexin.mp4 &  # 1. 先打开录制
adb shell am start -S -W  com.hexin.plat.android/.AndroidLogoActivity  # 2. 立马启动app
adb pull /data/local/tmp/hexin.mp4 .
ffmpeg -i hexin.mp4 hexin.gif
ffmpeg -i hexin.mp4 -r 10 frames_%03d.jpg
uiautomator自动化工具200ms巡检界面变化
traceview
硬埋点
1.2 app接口性能分析
1.3 webview性能分析
1. navigation
- navigation类型
- const unsigned short TYPE_NAVIGATE=0
- const unsigned short TYPE_RELOAD= 1
- const unsigned short TYPE_BACK_FORWARD= 2
2.判断当前动作
- window.performance.navigation.type
- TYPE_NAVIGATE = oT
- TYPE_RELOAD=1
- TYPE_BACK_FORWARD= 2
- adb logcat l grep http
3.查看webview url
- 查看:driver.execute_script(“return window.location.href”)
- 下载:adb pull /data/user/O/com.xueqiu.android/files/h5/modules_new/xxx~/Desktop/xxx.com
- adb logcat l grep http
chrome network分析工具
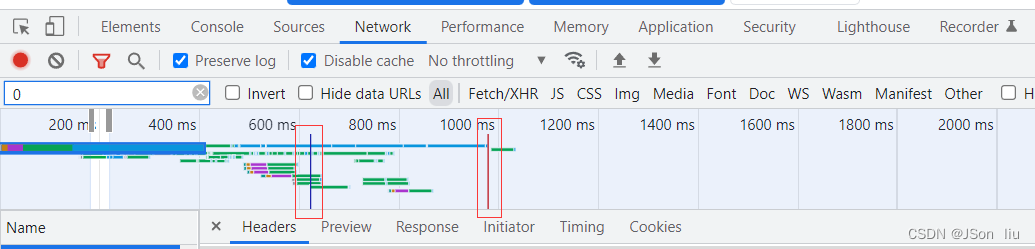
- Disable cache:不加载缓存,从零载入
- 蓝色线: dom出现
- 红色线:图片等资源已加载完
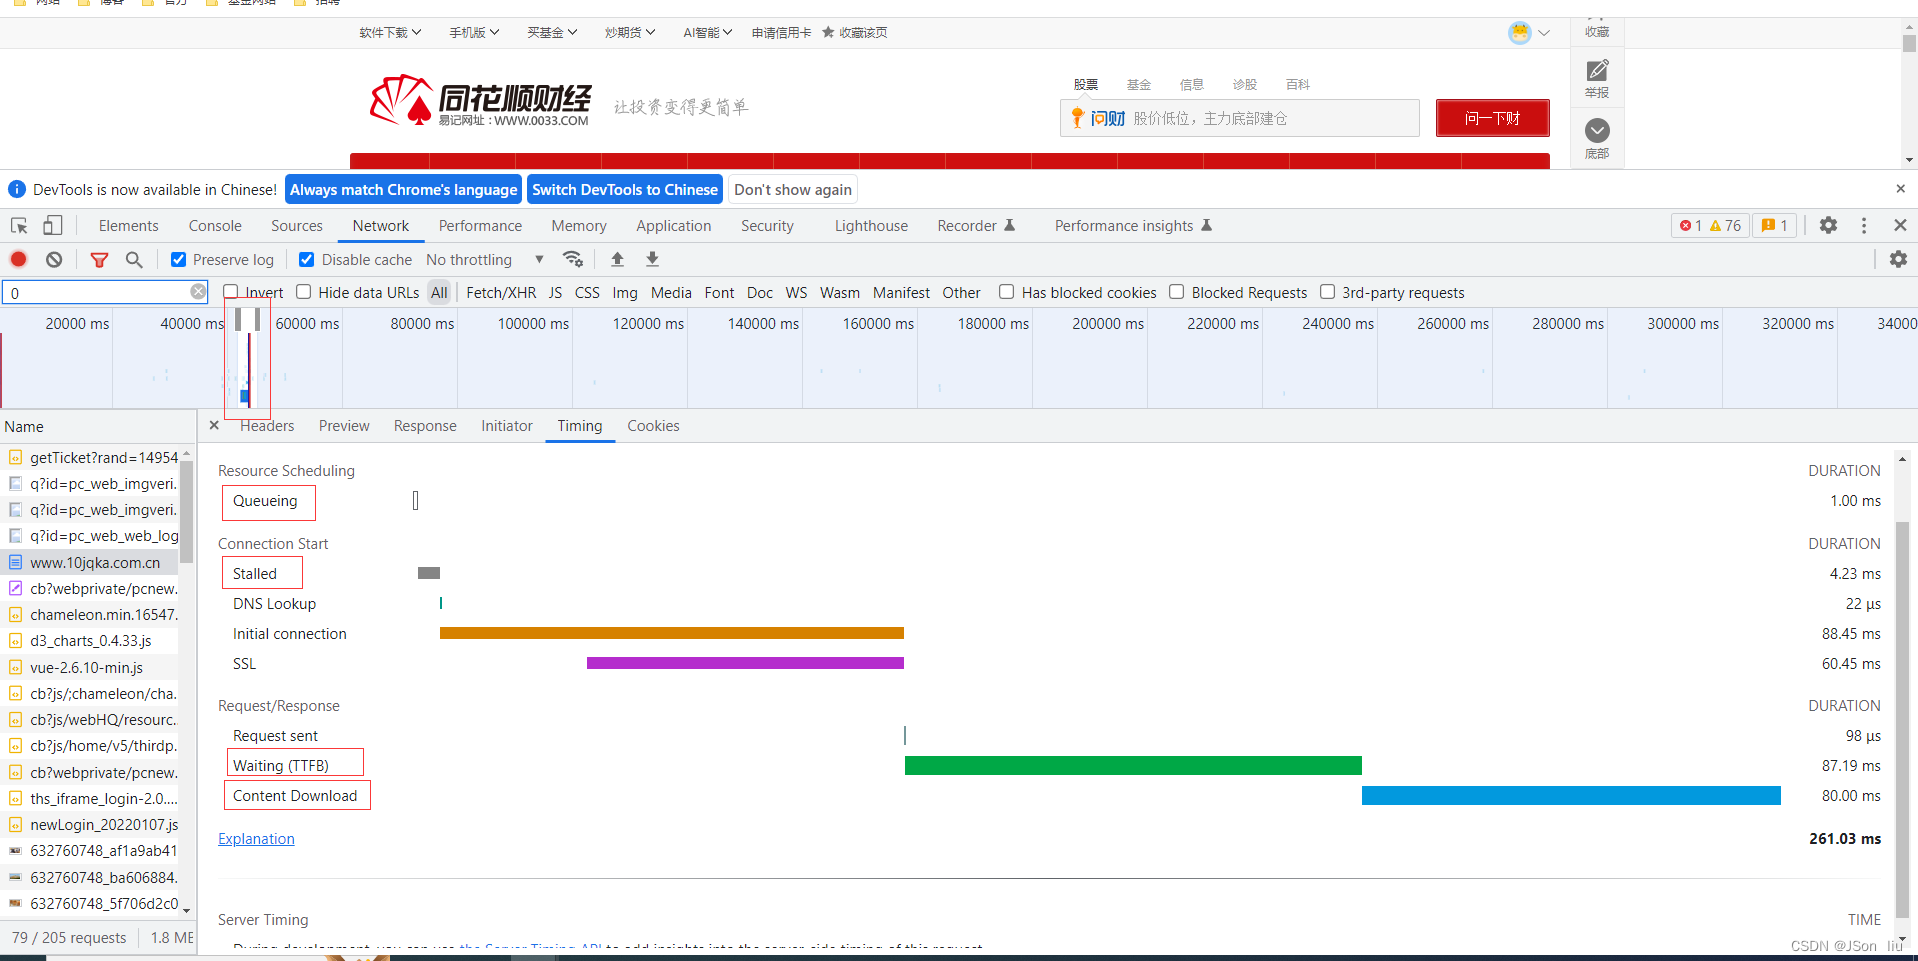
- Queueing:队列等待时间
- Stalled:在队列中,停止请求时间
- Waiting:服务器响应时间
- Content Download:内容下载时间
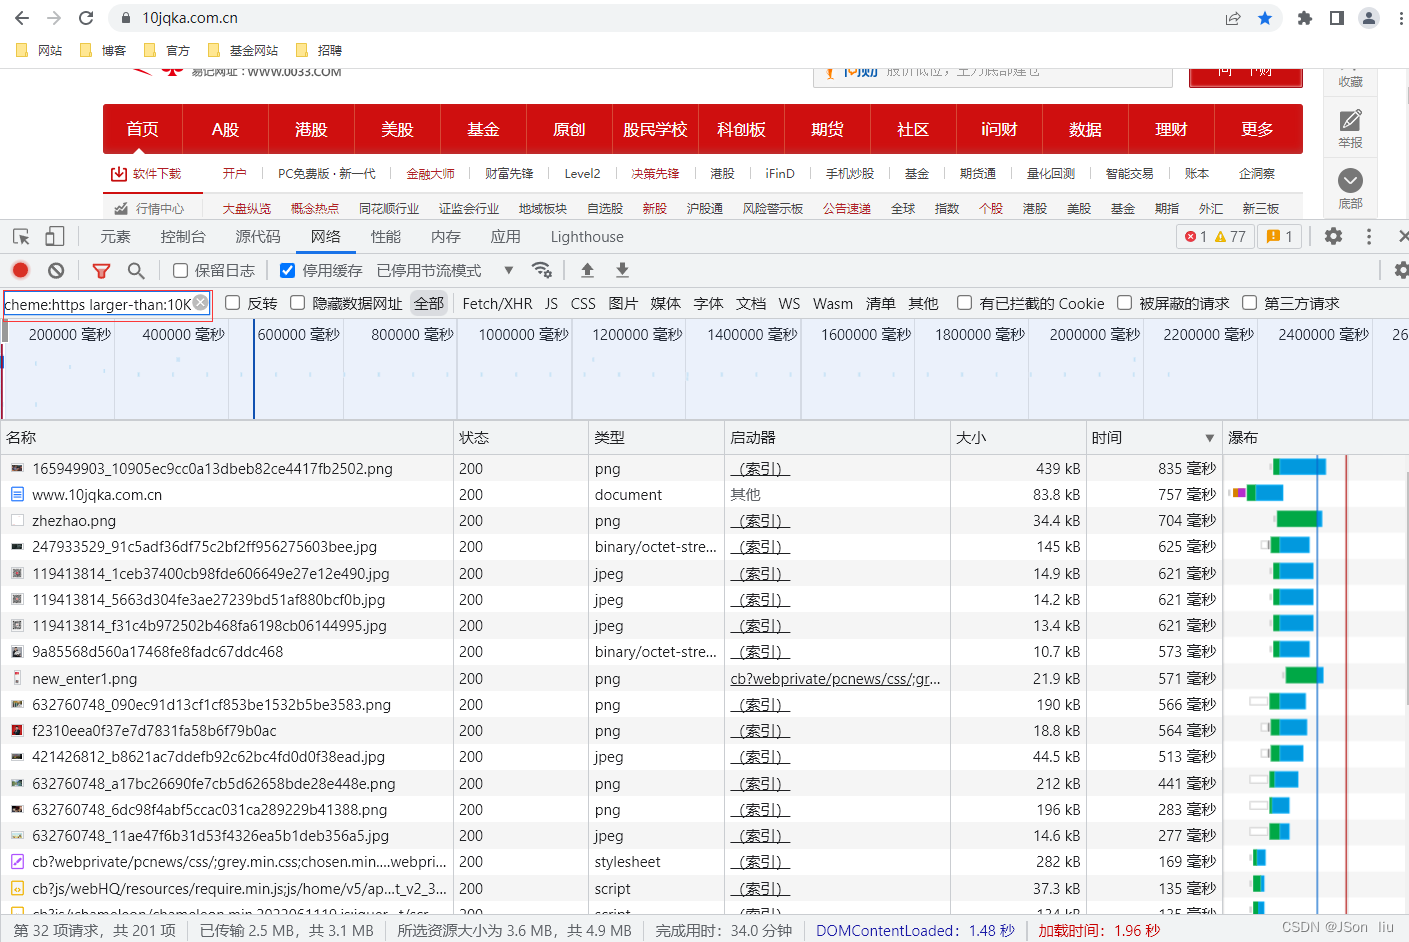
- 过滤表达式
domain.展示domain中的资源,*.comhas-response-header.:包含指定HTTP响应 headeris.:表达式larger-than.:展示大于某个尺寸的资源,1000等于1kmethod.:指定http请求方法,比如 get或者postmime-type.:资源mime类型,比如application/jsonscheme.HTTP(scheme:http)或者HTTPS(scheme:https).status-code.状态码
1.4 H5性能分析
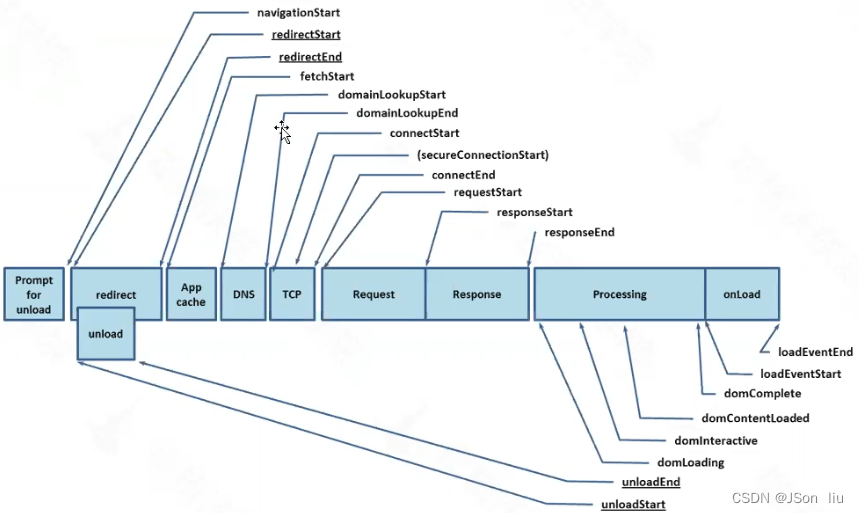
1.4.1 资源加载指标
prompt for unload:访问一个新页面时,旧页面卸载完成的时间redirect:重定向,用户注销登陆时返回主页面和跳转到其它的网站等app cache:检查缓存是否打开DNS(域名系统):DNS查询的时间,如果是长连接或者请求文件来自缓存等本地存储则返回FetchStart时间点tcp:与服务器建立链接的时间request:浏览器发起请求的时间response:拿到第一个响应字节到最后一个响应字节的时间processing:各种状态的时间点load:触发load事件执行的时间
1.4.2 chrome工具获取资源加载指标
1.4.3 python脚本方式获取资源加载指标
from appium import webdriver
from selenium.webdriver.common.by import By
def test_webview_performance():
caps = {}
caps["platformName"] = "Android"
caps["deviceName"] = "127.0.0.1:5554"
caps["appPackage"] = "com.hundsun.winner.pazq"
caps["appActivity"] = "com.hundsun.winner.pazqapp.ui.home.activity.NewSplashActivity"
caps['noReset'] = "true"
caps['chromedriverExecutable'] = r"C:/Users/xxx/AppData/Local/Google/Chrome/Application/chromedriver.exe"
driver = webdriver.Remote("http://localhost:4723/wd/hub", caps)
driver.implicitly_wait(15)
driver.find_element(By.XPATH, "//*[@text='理财']").click()
driver.find_element(By.XPATH, "//*[@text='活期']").click()
print(driver.contexts)
webview = driver.contexts[-1]
print(webview)
driver.switch_to.context(webview)
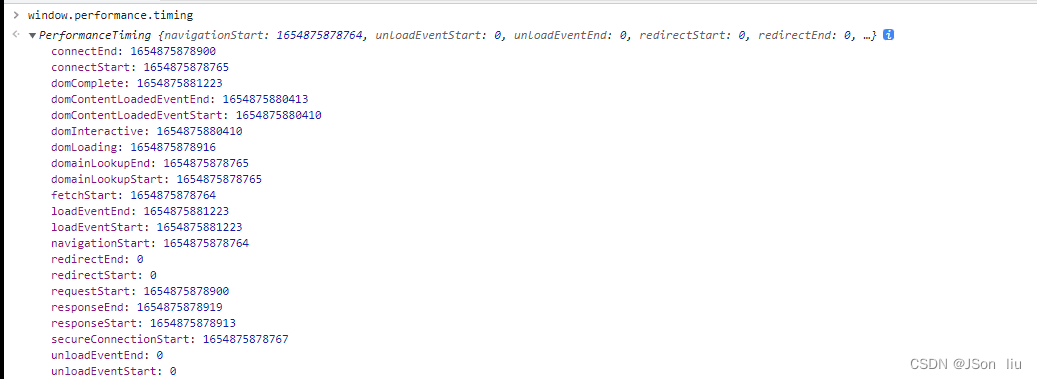
performance = driver.execute_script("return window.performance.timing")
print(performance)
print(int(performance['responseEnd']) - int(performance['connectStart']))
connect_time = (int(res['connectEnd']) - int(res['connectStart']))
load_event_time = (int(res['loadEventEnd']) - int(res['loadEventStart']))
dom_content_loaded_event_time = (int(res['domContentLoadedEventEnd']) - int(res['domContentLoadedEventStart']))
response_time = (int(res['responseEnd']) - int(res['responseStart']))
domain_look_up_time = (int(res['responseEnd']) - int(res['responseStart']))
print(str(connect_time) +'ms')
print(str(load_event_time) +'ms')
print(str(dom_content_loaded_event_time) +'ms')
print(str(response_time) +'ms')
print(str(domain_look_up_time) +'ms')
for i in res.keys():
print(i+':',res[i])
if __name__ == '__main__':
test_webview_performance()
1.5 卡顿分析
1.5.1环境依赖
- python2.7
- sdk/platform-tools/systrace.py
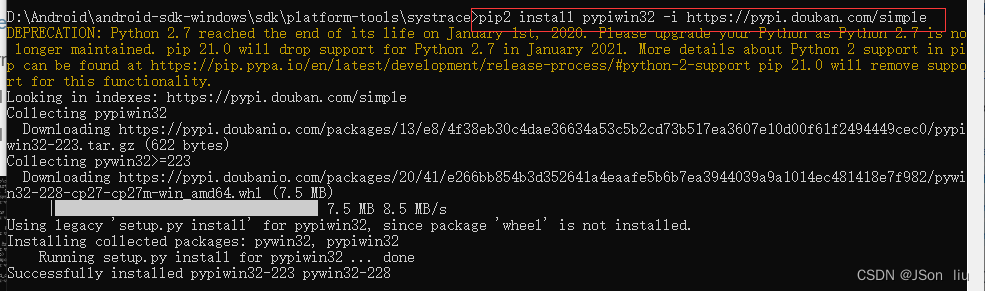
- pip2 install pypiwin32
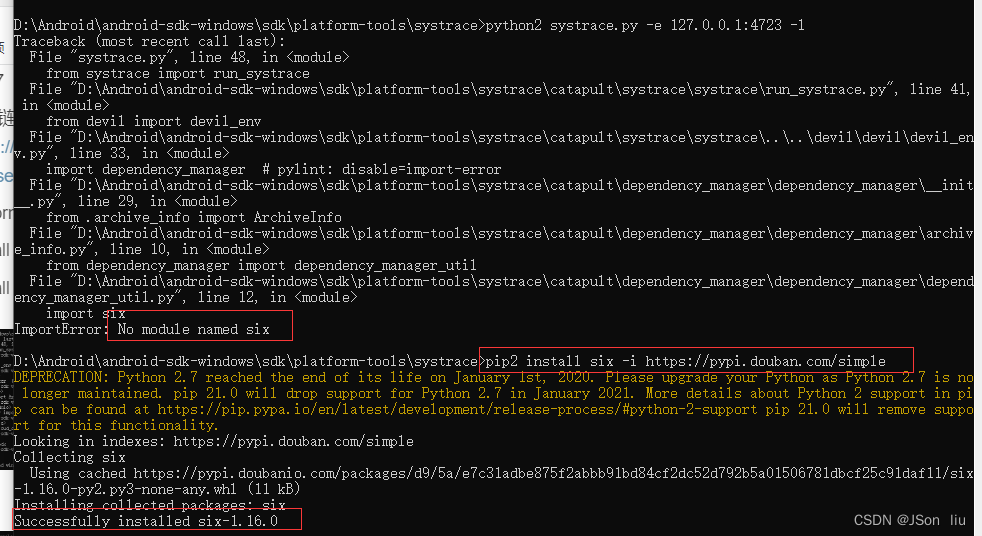
- pip2 install six
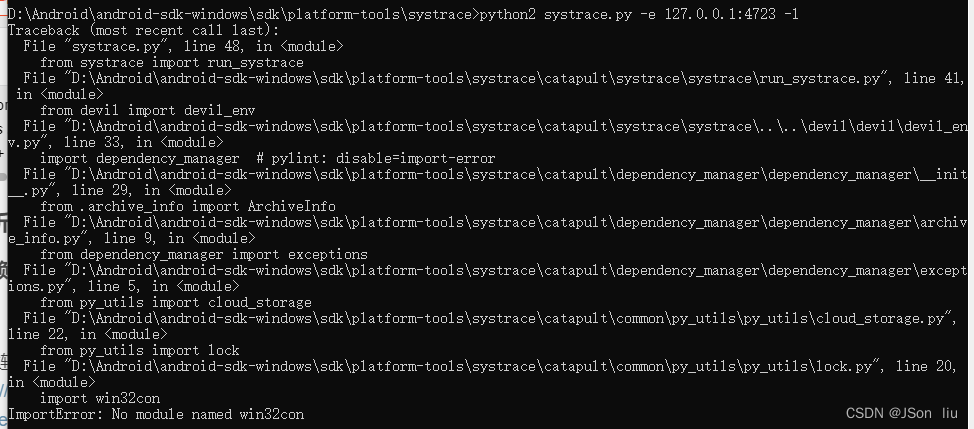
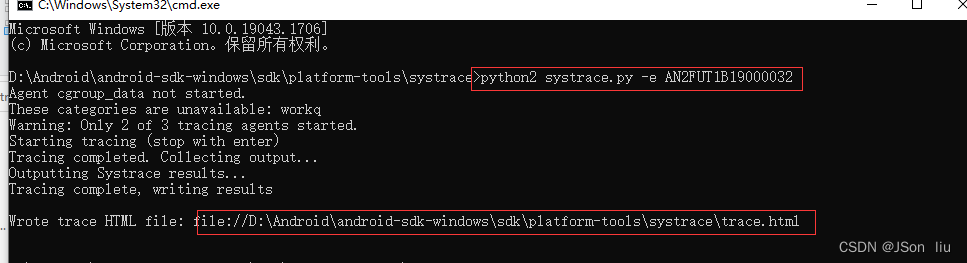
1.5.2systrace 使用
python2 systrace.py -e 设备名称 -l -o D:\Android\android-sdk-windows\sdk\platform-tools\systrace\result.html
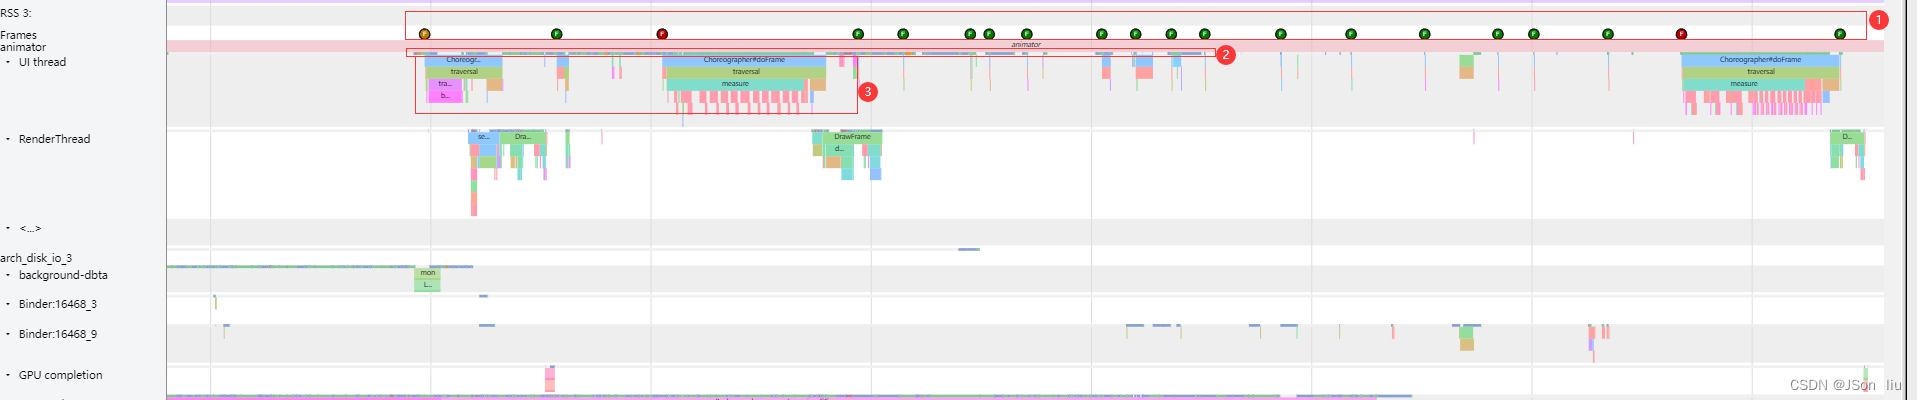
1.5.3 关键指标
- 帧点
- 绿: 16.6ms内,黄,红超过16.6ms
- 任务状态
- 灰:休眠,蓝色:可运行,绿色:运行,橙色:不响应信号
3:函数调用
1.5.4 影响卡顿因素
- 内存(内存闪退、内存溢出)
- cpu(计算耗时)
- render(布局、overdraw)
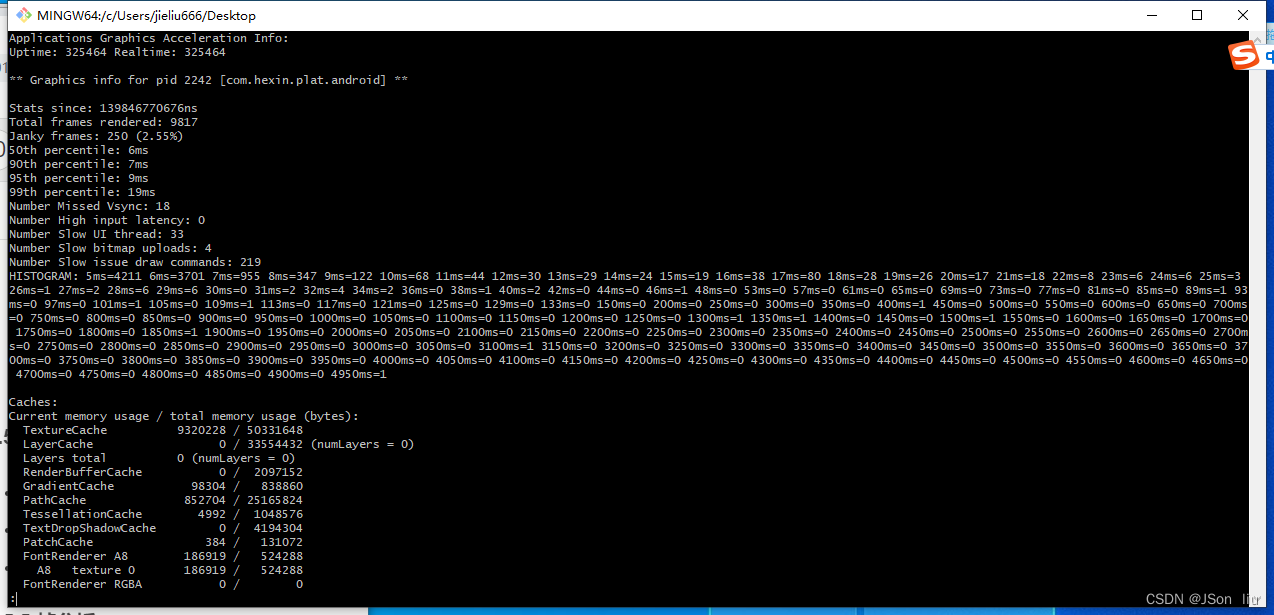
1.5.5 帧分析
- 冰冻帧:一个帧超过0.7s
- 帧分析:
adb -s emulator-5554 shell dumpsys gfxinfo | less
1.6 系统资源分析
1.6.1 CPU
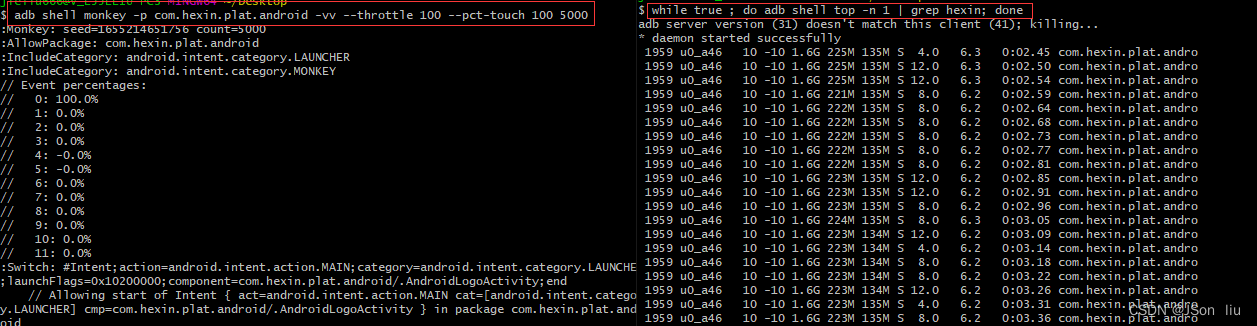
结合monkey工具一起使用:
- adb shell monkey -p 包名 -vv --throttle 延时时间(s) --pct-触发事件 触发事件占比率 运行次数
- adb shell monkey -p com.hexin.plat.android -vv --throttle 100 --pct-touch 100 5000
- adb shell top -n 1 | grep 关键字
- adb shell top -n 1 | grep 关键字 | awk ‘{print $3}’
- while true ; do adb shell top -n 1 | grep 关键字 | awk ‘{print $3}’; done
1.6.2 综合性能分析
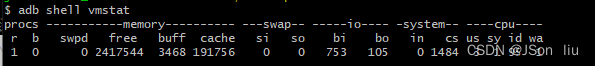
1. adb shell vmstat
- procs:协议
- r:队列
- b:阻塞的进程
- memory:内存
- swpd:虚拟内存使用大小
- free:空闲物理内存大小
- buff:缓存
- cache:缓冲
- swap:磁盘
- si:每秒从磁盘读入虚拟内存的大小
- so:每秒虚拟内存写入磁盘的大小
- io
- bi:块设备每秒接收的块数量
- bo:块设备发送的块数量
- system:系统
- in:每秒cpu中断次数
- cs:每秒上下文切换次
- cpu:中央处理单元
- us:用户cpu时间
- sy:系统状态
- id:空闲cpu时间
- wa:等待IO CPU时间
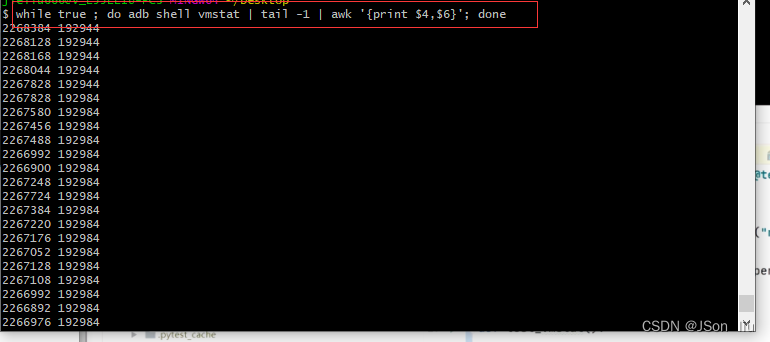
2. 命令行方式系统指标提取
- while true ; do adb shell vmstat | tail -1 | awk ‘{print $4}’; done
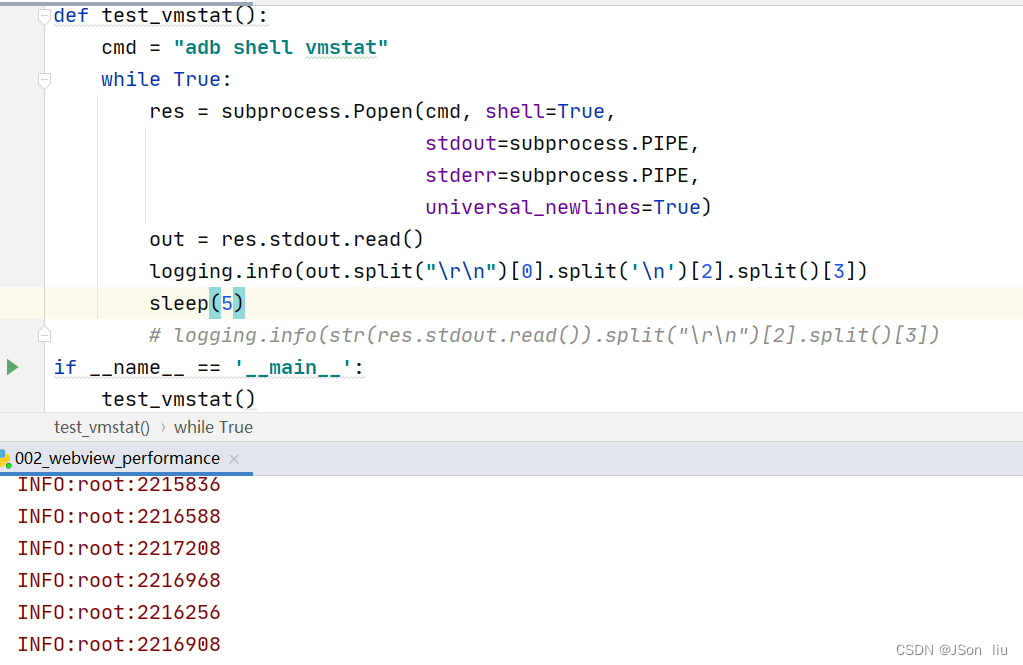
3. appium方式系统指标提取
import logging
import subprocess
logging.basicConfig(level=logging.INFO)
def test_vmstat():
    cmd = "adb shell vmstat"
    while True:
        res = subprocess.Popen(cmd, shell=True,
                               stdout=subprocess.PIPE,
                               stderr=subprocess.PIPE,
                               universal_newlines=True)
        out = res.stdout.read()
        logging.info(out.split("\r\n")[0].split('\n')[2].split()[3])
        sleep(5)
        # logging.info(str(res.stdout.read()).split("\r\n")[2].split()[3])
if __name__ == '__main__':
    test_vmstat()
1.6.3 GPU
1. GPU工作原理
- 图形API不允许CPU直接与GPU通信
- 通过中间层来连接这两部分
- 中间层维护一个队列
- CPU把display list放入队列
- GPU从队列取数据进行绘制
2. android GPU渲染分析工具
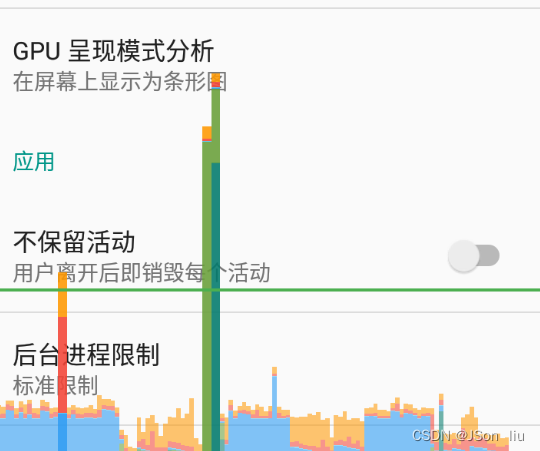
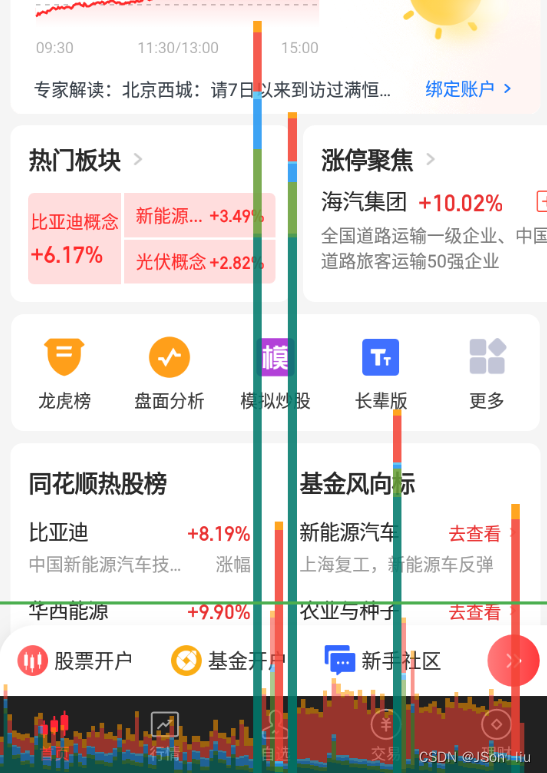
** 参数分析**
- 绘制每一帧所消耗的时间
- 不同的颜色代表UI绘制的不同阶段
- 并且在柱状图的中间还有一根绿色的横线代表16ms的绘制时间基准
- GRP会统计并显示app最近运行的128帧
常用颜色解读
官网参考:https://developer.android.com/topic/performance/rendering/inspect-gpu-rendering
- 蓝色
- View需要先转换为GPU能识别的格式
- 蓝色较高
- view突然无效( invalidate)
- onDraw函数中做了复杂的绘制逻辑
- 红色:
- OpenGL处理DISPLAYLIST,将处理结果传 递给GPU
- 红色较高
- view过于复杂 view重复提交
- onDraw函数中做了复杂的绘制逻辑
- 橙色:
- cpu在等待gpu完成工作
- 橙色较高
- GPU任务太多,复杂的view绘制
- 墨绿色
- 在连续两帧间的时间间隔,可能是因为子线程执行时间过长抢占了UI线程被cpu执行的机
会
- 在连续两帧间的时间间隔,可能是因为子线程执行时间过长抢占了UI线程被cpu执行的机
- 深绿色
- app在用户输入事件回调中花费的时间,
- 深绿色过高
- 可能app处理用户输入事件时间
过长,建议将操作分流到工作线程
- 可能app处理用户输入事件时间
- 绿色
- 为该帧内所有animator求值(属性动画中代表通过估值器计算属性的具体值)所花费的时间
- 绿色过高
- 自定义animator性能不佳或者更新view属性引发了某些意外操作
- 淡绿色
- onLayout和onMeasure方法消耗的总时间,
- 淡绿色过高:
- 遍历整个view树维构花费了太多时间
1.6.4 memory统计
1. 指标解析
- VSS(Virtula set size):虚拟耗用内存(包含共享库占用的内存)
- 衡量虚拟内存大小无太大用处,无法知道分配的物理内存大小
- RSS(resident set size):实际使用的物理内存(包含共享库占用的内存)
- 各进程的RSS相加,会超过系统内存使用量
- USS(unique set size):实际使用的物理内存(不包含共享库占用的内存)
- 是PSS中自己的部分,不包含任何共享的部分
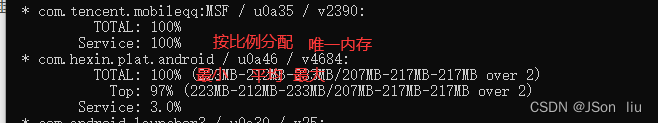
- PSS(proportional set size):实际使用的物理内存(比例分配共享库占用的内存)
- 各进程的PSS之和,就是系统的内存使用量
- 内存占用大小:VSS >= RSS >= PSS >= USS
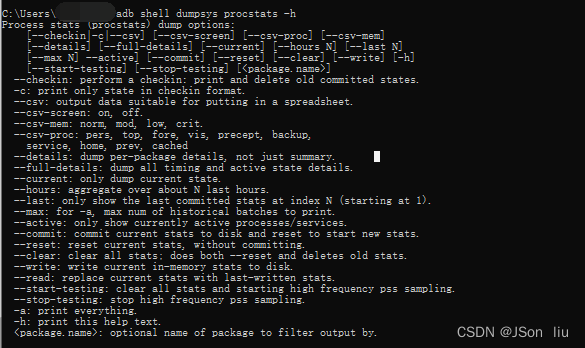
2. 内存分析工具:procstats
- 查看帮助文档:adb shell dumpsys procstats -h
- 内存查看:adb shell dumpsys procstats --hours 小时数
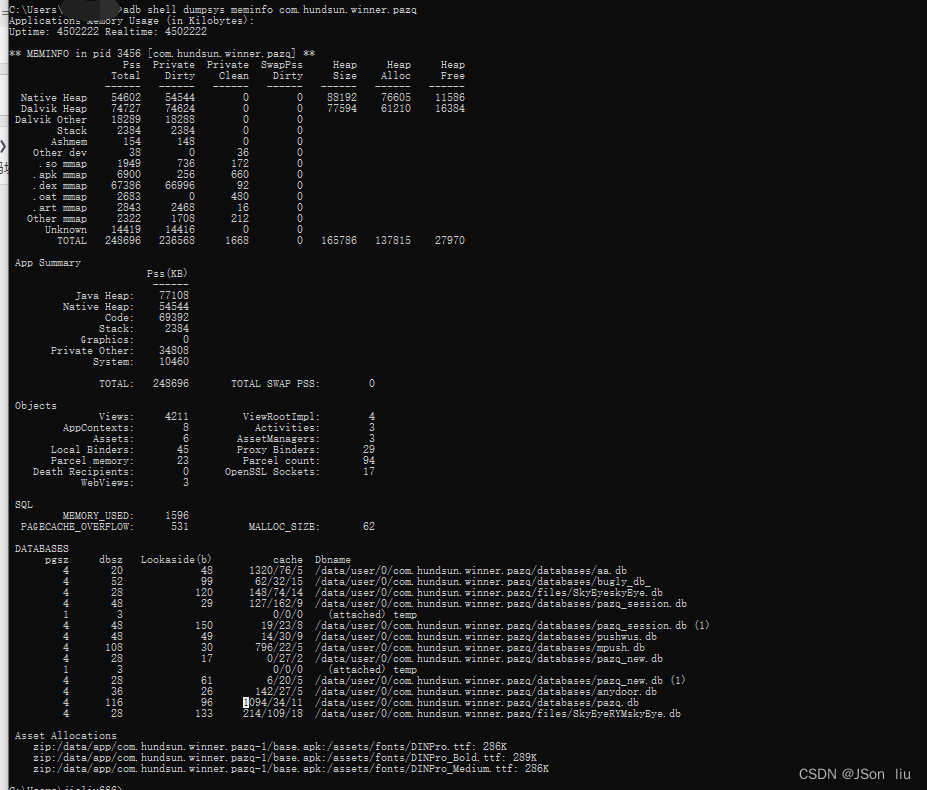
- 查看指定进程的meminfo:
abd shell dumpsys meminfo 包名
1.6.5 网络流量分析
1.常用命令
- 获取应用id:adb shell dumpsys package 包名 | findstr userId
- 获取网络数据:adb shell dumpsys netstats | findstr userId
2.相关术语
Active interfaces:活动接口- iface=wlan0 ident=[{type=WIFI,subType=COMBINED,networkId=“GoogleGuest”}]
Active UID interfaces:活动UID接口- iface=wlan0 ident=[{type=WIFI, subType=COMBINED,networkId=“GoogleGuest”}]
Dev statistics:开发统计信息xt statistics: Xt统计信息- `UID statistics : UID统计信息
UID tag statistics: UID代码统计信息
3.应用流量情况
- set=DEFAULT:前台网络使用情况
- set=BACKGROUND:后台使用情况
- set=ALL:上述两类使用情况。
- tag=0x0:与流量关联的套接字代码。
- rxBytes和 rxPackets:在相应时间间隔内接收的字节数和数据包数txBytes和 txPackets在相应时间间隔内发送的字节数和数据包数
1.7 耗电量分析
1.7.1 环境准备
1.下载go
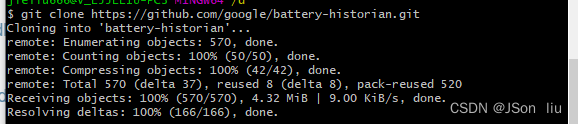
2.下载historain:
git clone https://github.com/google/battery-historian.git
3. 下载依赖:
go get -d -u github.com/google/battery-historian/...
4.启动go:
cd battery-historian
run setup.go
5. 启动battery-histain工具:
go run cmd/battery-historian/battery-historian.go [--port <default:9999>]
1.7.2 测试流程
1.batterystats收集数据
- 1)清理耗电量数据
- adb shell dumpsys batterystats --reset
- 2)开启电量收集:
- adb shell dumpsys batterystats --enable full-wake-history
- 3)运行测试用例/手工操作手机
- 4)收集数据
- Android 7.0:
adb bugreport bugreport.zip - Android6.0:
adb bugreport > bugreport.txt
- Android 7.0:
2.上传数据
- 打开localhost:9999,把zip或txt文件上传
3.测试报告生成
4.进入historian
1.7.3 常用指标
- battery_level:电量
- plugged:充电状态及充电的时长screen:屏幕是否点亮
- top:显示当前手机运行的app
- status:电池状态信息,有充电,放电,未充电,已充满,未知等不同状态
1.8 耗电量分析
1. 弱网问题
封闭环境,网速降低丢包
- 丢包
- 数据无法加载
- 消息更新不及时
2. 弱网速度
- 低于2G速率
- 3G


 1505
1505


 被折叠的 条评论
为什么被折叠?
被折叠的 条评论
为什么被折叠?
 到【灌水乐园】发言


