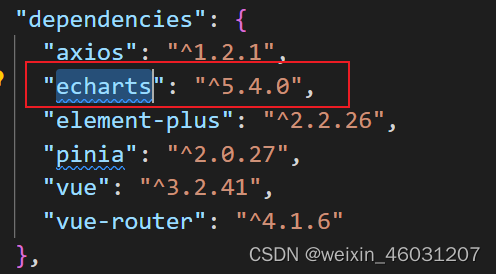
Echarts版本:
- echarts引入
import * as echarts from "echarts";

//k折线图
  simpleData().then((ok: any) => {
    console.log("折线图", ok);
    console.log(ok.data);

    // 基于准备好的dom,初始化echarts实例
    var myChart = echarts.init(
      document.getElementById("main") as HTMLDivElement
    );

    var option = {
      title: {
        text: "折线图",
        left: 'center',
        top: 20,
        textStyle: {
          color: "#f00",
        },
      },
      tooltip: {
        trigger: "axis",
      },
      xAxis: {
        type: "category",
        data: ok.data.map((item: any) => item.x),
      },
      yAxis: {
        type: "value",
      },
      series: [
        {
          data: ok.data.map((item: any) => item.val),
          type: "line",
          markPoint: {
            data: [
              {
                type: "max",
                name: "最大值",
              },
              {
                type: "min",
                name: "最小值",
              },
            ],
          },
        },
      ],
    };
    // 使用刚指定的配置项和数据显示图表。
    myChart.setOption(option);
  });
- 饼图
  // 饼图
  simpleData().then((ok: any) => {
    console.log("饼图", ok);
    console.log(ok.data);

    // 基于准备好的dom,初始化echarts实例
    var myChart = echarts.init(
      document.getElementById("two") as HTMLDivElement, 'dark'
    );
    let seriesData = reactive({
      arr: [],
    });
    ok.data.forEach((item: any) => {
      let obj = reactive({
        newobj: {},
      });
      obj.newobj = {
        name: item.x,
        value: item.val,
      };
      seriesData.arr.push(obj.newobj);
    });
    console.log(seriesData.arr);
    var option = {
      title: {
        text: "饼图",
        left: 'center',
        top: 20,
        textStyle: {
          color: "#f00",
        },
      },
      legend: {
        top: "bottom",
      },
      toolbox: {
        show: true,
        // feature: {
        //   mark: { show: true },
        //   dataView: { show: true, readOnly: false },
        //   restore: { show: true },
        //   saveAsImage: { show: true },
        // },
      },
      series: [
        {
          name: "Nightingale Chart",
          type: "pie",
          radius: [50, 250],
          center: ["50%", "50%"],
          roseType: "area",
          itemStyle: {
            borderRadius: 8,
            normal: {
              label: {
                show: true,
                formatter: "{b} : {c} ({d}%)",
              },
              labelLine: { show: true },
            },
          },
          data: seriesData.arr,
        },
      ],
    };

    // 使用刚指定的配置项和数据显示图表。
    myChart.setOption(option);
  });
二、多个请求发送
可以使用 promise
  //   prolist().then((ok) => {
  //     console.log(ok);
  //     arr.data = ok.data;
  //   });

  //   prolisttotal().then((ok)=>{
  //     console.log(ok.data.length);
  //     listnum.value = ok.data.length
  //   })

  Promise.all([prolist(), prolisttotal()]).then((ok) => {
    console.log(ok);
    arr.data = ok[0].data;
    listnum.value = ok[1].data.length;
  });
三、使用async修饰请求
// onMounted(()=>{
//     bannerlist().then((ok)=>{
//         console.log(ok);
//     })
// })
onMounted(async () => {
  let ok = await bannerlist();
  console.log(ok.data);
  arr.data = ok.data;
  console.log(arr.data);
});
四、删除操作
const handleDelete = (index: number, row: any) => {
  console.log(index, row.adminid);

  ElMessageBox.confirm("是否删除?", "删除", {
    confirmButtonText: "确定",
    cancelButtonText: "取消",
    type: "warning",
  })
    .then(() => {
      admindelete(row.adminid).then((ok:any) => {
        console.log(ok);
      });
    })
    .catch(() => {});
};


 561
561


 被折叠的 条评论
为什么被折叠?


