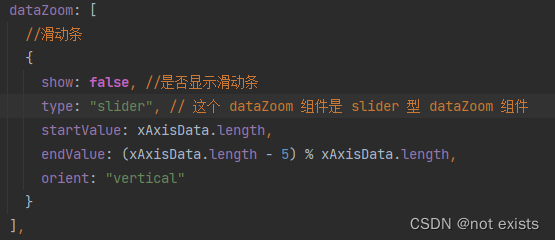
1. 动画效果-dataZoom配置
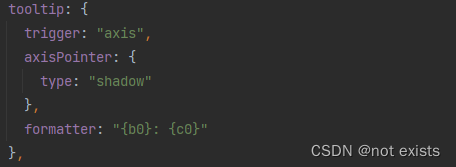
2.动画效果 - tooltip 配置
3.props 属性
引入/挂载组件 传入参数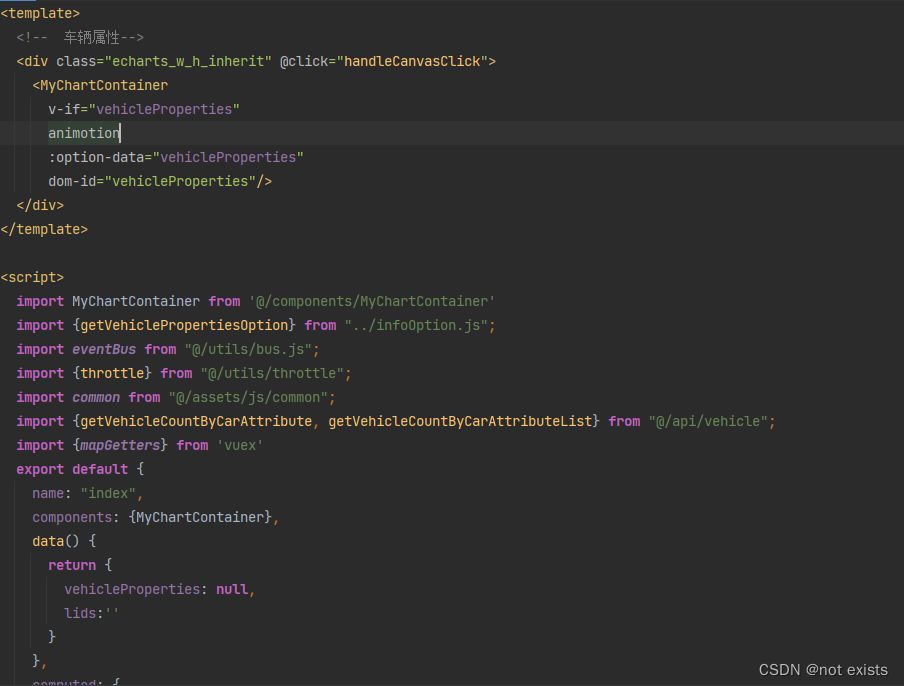
<template>
<div :id="domId" style="width: inherit;height: inherit; cursor: pointer"></div>
</template>
<script>
import echarts from "echarts";
export default {
name: "chartContainer",
props: {
domId: {
type: String,
default: ''
},
optionData: {
type: Object,
default: () => {
return {
name: ''
}
},
},
animotion: {
type: Boolean,
default: false
}
},
watch: {
optionData(value, oldValue) {
this.currentOption = value;
if (this.animotion) {
this.clearTimeAnimation()
this.set_Animation()
} else {
this.setOption();
}
}
},
data() {
return {
chartExample: null,
time_Highlight: null,
time_dataZoom: null,
currentOption: this.optionData,
}
},
methods: {
initEcharts() {
this.chartExample = echarts.init(document.getElementById(this.domId));
this.chartExample.on('click', (params) => {
this.$emit('canvas-click', params, this.chartExample)
})
this.chartExample.on("legendselectchanged", (e) => {
event.stopPropagation();
console.log(e)
})
if (this.animotion) {
this.clearTimeAnimation()
this.set_Animation()
} else {
this.setOption();
}
},
setOption() {
this.currentOption && this.chartExample.setOption(this.currentOption);
},
getChartExample() {
this.$emit('get-chart-example', this.chartExample)
},
clearTimeAnimation() {
if (this.time_dataZoom) {
clearInterval(this.time_dataZoom)
}
if (this.time_Highlight) {
clearInterval(this.time_Highlight)
}
},
set_Animation() {
if (Object.keys(this.currentOption).length <= 0) {
return;
}
var that = this;
var option = this.currentOption;
let dataZoom = option.dataZoom ? true : false;
let tooltip = option.tooltip ? true : false;
that.chartExample.on('mouseover', (params) => {
this.clearTimeAnimation();
that.chartExample.dispatchAction({
type: 'downplay',
seriesIndex: seriesIndex
});
that.chartExample.dispatchAction({
type: 'highlight',
seriesIndex: seriesIndex,
dataIndex: params.dataIndex
});
tooltip && that.chartExample.dispatchAction({
type: 'showTip',
seriesIndex: 0,
dataIndex: params.dataIndex,
});
that.time_Highlight = null;
that.time_dataZoom = null;
})
that.chartExample.on('mouseout', () => {
that.chartExample.dispatchAction({
type: 'downplay',
seriesIndex: seriesIndex
});
this.clearTimeAnimation();
setHighlight()
dataZoom && setDataZoom()
})
var myChartIndex = 0;
var dataLen = option.series[0].data.length;
var seriesIndex = option.series.map((item, index) => (index))
var isReDataZoom = false;
var orientZoom = dataZoom && option.dataZoom[0].orient === 'vertical' ? true : false;
if (orientZoom) {
myChartIndex = dataLen - 1;
}
var dataZoomStartIndex = dataZoom ? option.dataZoom[0].startValue : 0;
var dataZoomEndIndex = dataZoom ? option.dataZoom[0].endValue : 5;
function setHighlight() {
option && that.chartExample.setOption(option);
that.time_Highlight = setInterval(() => {
that.chartExample.dispatchAction({
type: 'downplay',
seriesIndex: seriesIndex,
dataIndex: myChartIndex
});
tooltip && that.chartExample.dispatchAction({
type: 'hideTip',
seriesIndex: 0,
dataIndex: myChartIndex
});
if (orientZoom) {
myChartIndex = (myChartIndex - 1) % dataLen;
if (myChartIndex < 0) {
myChartIndex = dataLen;
isReDataZoom = true;
}
} else {
myChartIndex = (myChartIndex + 1) % dataLen;
if (myChartIndex === 0) {
isReDataZoom = true;
}
}
that.chartExample.dispatchAction({
type: 'highlight',
seriesIndex: seriesIndex,
dataIndex: myChartIndex
});
tooltip && that.chartExample.dispatchAction({
type: 'showTip',
seriesIndex: 0,
dataIndex: myChartIndex
});
}, 1950)
}
function setDataZoom() {
if (!dataZoom) return
that.time_dataZoom = setInterval(() => {
if (isReDataZoom) {
isReDataZoom = false;
option.dataZoom[0].endValue = dataZoomEndIndex;
option.dataZoom[0].startValue = dataZoomStartIndex;
} else {
if (orientZoom) {
option.dataZoom[0].endValue = option.dataZoom[0].endValue - 1;
option.dataZoom[0].startValue = option.dataZoom[0].startValue - 1;
} else {
option.dataZoom[0].endValue = option.dataZoom[0].endValue + 1;
option.dataZoom[0].startValue = option.dataZoom[0].startValue + 1;
}
}
option && that.chartExample.setOption(option);
}, 2350);
}
if (dataZoom) {
this.chartExample && setHighlight();
this.chartExample && setDataZoom();
} else {
this.chartExample && setHighlight()
}
}
},
mounted() {
this.initEcharts()
},
beforeDestroy() {
this.clearTimeAnimation()
this.chartExample && this.chartExample.dispose()
this.chartExample = null;
}
}
</script>


 435
435


 被折叠的 条评论
为什么被折叠?
被折叠的 条评论
为什么被折叠?
 到【灌水乐园】发言


