


由于自己写的时候,发现关于antv G6关系图的案例少之又少,因此,我将我实现的demo发出来,供大家借鉴
讲的不清楚的地方大家可以随时留言
1.antvG6关系图实现案例
<template>
  <div ref="ComplexTrees">
    <div id="home" style="width: 100%; height: 600px"></div>
  </div>
</template>

  <script>
import G6 from "@antv/g6";
export default {
  name: "home",
  data() {
    return {
      myChart: {},
      graph:null,
      data : {
  nodes: [
    {
      id: '0',
      label: '0',
    },
    {
      id: '1',
      label: '1',
    },
    {
      id: '2',
      label: '2',
    },
    {
      id: '3',
      label: '3',
    },
    {
      id: '4',
      label: '4',
    },
    {
      id: '5',
      label: '5',
    },
    {
      id: '6',
      label: '6',
    },
    {
      id: '7',
      label: '7',
    },
    {
      id: '8',
      label: '8',
    },
    {
      id: '9',
      label: '9',
    },
    {
      id: '10',
      label: '10',
    },
    {
      id: '11',
      label: '11',
    },
    {
      id: '12',
      label: '12',
    },
    {
      id: '13',
      label: '13',
    },
    {
      id: '14',
      label: '14',
    },
    {
      id: '15',
      label: '15',
    },
  ],
  edges: [
    {
      source: '0',
      target: '1',
    },
    {
      source: '0',
      target: '2',
    },
    {
      source: '0',
      target: '3',
    },
    {
      source: '0',
      target: '4',
    },
    {
      source: '0',
      target: '5',
    },
    {
      source: '0',
      target: '7',
    },
    {
      source: '0',
      target: '8',
    },
    {
      source: '0',
      target: '9',
    },
    {
      source: '0',
      target: '10',
    },
    {
      source: '0',
      target: '11',
    },
    {
      source: '0',
      target: '13',
    },
    {
      source: '0',
      target: '14',
    },
    {
      source: '0',
      target: '15',
    },
    {
      source: '2',
      target: '3',
    },
    {
      source: '4',
      target: '5',
    },
    {
      source: '4',
      target: '6',
    },
    {
      source: '5',
      target: '6',
    },
    {
      source: '7',
      target: '13',
    },
    {
      source: '8',
      target: '14',
    },
    {
      source: '9',
      target: '10',
    },
    {
      source: '10',
      target: '14',
    },
    {
      source: '10',
      target: '12',
    },
    {
      source: '11',
      target: '14',
    },
    {
      source: '12',
      target: '13',
    },
  ],
};
    };
  },
 created(){
    this.setOption() //页面初始调用
  },
  methods: {
    // 图标绘制
    setOption() {
      this.graph = new G6.Graph({
        container: "home",
        fitView: true,
        modes: {
          default: ['drag-canvas', 'zoom-canvas', 'drag-node'] // 允许拖拽画布、放缩画布、拖拽节点
        },
        layout: {
          type: "dagre",
          rankdir: "LR",
          align: "DL",
          nodesepFunc: () => 1,
          ranksepFunc: () => 1,
        },
        defaultNode: {
          size: [150, 40],
          type: "rect", //修改为矩形
          labelCfg: {
            style: {
              fill: '#fff',
            },
            position: 'center'
          },
          style: {
            lineWidth: 2,
            stroke: "#1890ff",
            fill: "#1890ff",
          },
        },
        defaultEdge: {
          size: 2,
          color: "#B5AFAF",
          style: {
            endArrow: {
              path: "M 0,0 L 8,4 L 8,-4 Z",
              fill: "#B5AFAF",
            },
          },
        },
      });
      this.graph.data(this.data);
      this.graph.render();

    },

  },
};
</script>
2.将图形导出成图片
 // 导出单个图表图片
    download() {
        this.graph.downloadFullImage('tree-graph', 'image/png', {
          backgroundColor: '#fff',
          padding: [30, 15, 15, 15],
        });
    },
3.动态数据清空
//1.判断this.graph是否存在,若存在就销毁
if (this.graph) {
this.graph.destroy();
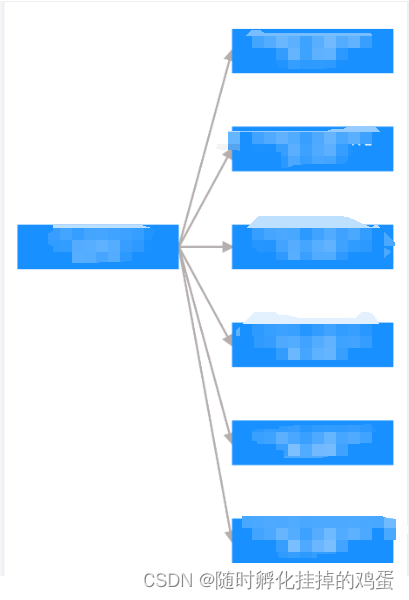
}4.效果图(是这个形状,由于我的数据不是上述数据,因此打码)


 被折叠的 条评论
为什么被折叠?
被折叠的 条评论
为什么被折叠?
 到【灌水乐园】发言


