


我这里是使用 npm 安装的
安装:
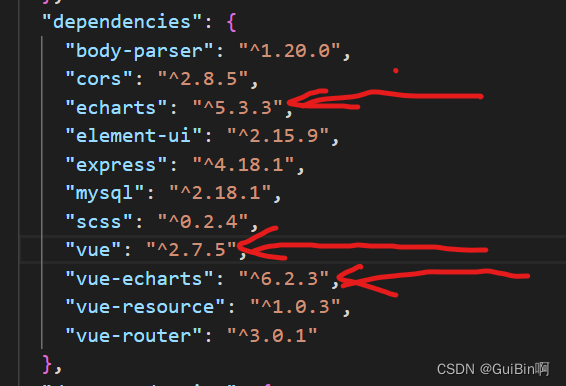
npm install echarts vue-echarts我这里的版本
在main.js 中引入
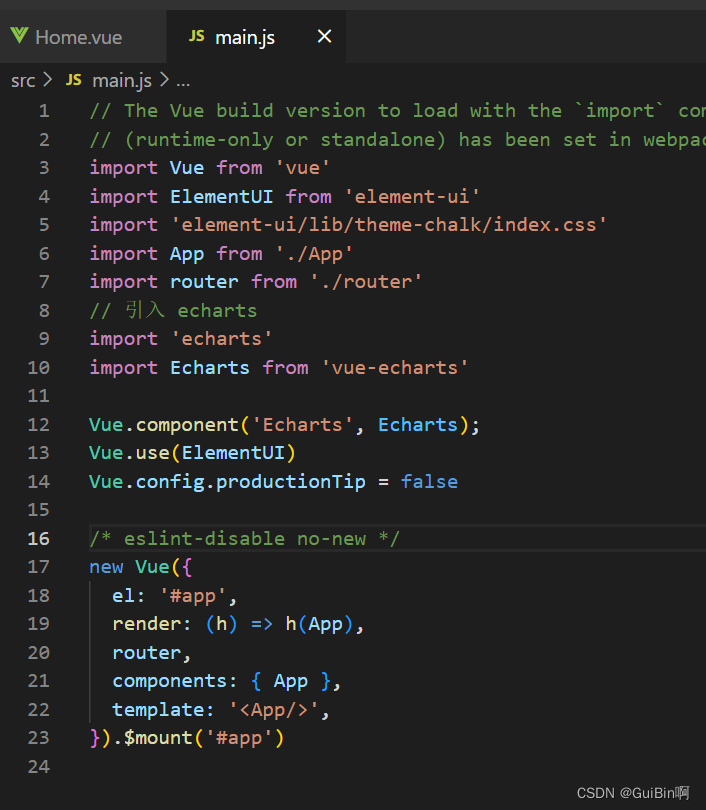
// 引入 echarts
import 'echarts'
import Echarts from 'vue-echarts'

Vue.component('Echarts', Echarts);

new Vue ({
    el: '#app',
    render: (h) => h(App)
}).$mount('#app')
在组件中使用:
<template>
// v-chart 默认宽高为 0
    <v-chart class="chart" :option="option"></v-chart>
</template>

<script>
// 引入 echart 需要模块
import { use } from 'echarts/core';
import { CanvasRenderer } from 'echarts/renderers';
import { PieChart } from 'echarts/charts';
import {
  TitleComponent,
  TooltipComponent,
  LegendComponent,
} from 'echarts/components';
import VChart, { THEME_KEY } from 'vue-echarts';
import { ref, defineComponent } from 'vue';

use([
  CanvasRenderer,
  PieChart,
  TitleComponent,
  TooltipComponent,
  LegendComponent,
]);

export default defineComponent({
  components: {
    VChart
  },
  provide: {
    [THEME_KEY]: 'dark'
  },
  setup() {
    const option = ref({
       title: {
       text: 'Traffic Sources',
         left: 'center',
       },
       tooltip: {
         trigger: 'item',
         formatter: '{a} <br/>{b} : {c} ({d}%)',
       },
       legend: {
         orient: 'vertical',
         left: 'left',
         data: ['Direct', 'Email', 'Ad Networks', 'Video Ads', 'Search Engines'],
       },
       series: [
         {
           name: 'Traffic Sources',
           type: 'pie',
           radius: '55%',
           center: ['50%', '60%'],
           data: [
             { value: 335, name: 'Direct' },
             { value: 310, name: 'Email' },
             { value: 234, name: 'Ad Networks' },
             { value: 135, name: 'Video Ads' },
             { value: 1548, name: 'Search Engines' },
           ],
           emphasis: {
             itemStyle: {
               shadowBlur: 10,
               shadowOffsetX: 0,
               shadowColor: 'rgba(0, 0, 0, 0.5)',
             },
           },
         },
       ],
    });
    return { option };
  },
})
</script>

<style scoped>
// 要给初始值 否则会看不见
  .chart {
    height: 100vh;
  }
</style>参考:echarts 官网
github实例![]() https://stackblitz.com/edit/vue-echarts-vue-2-global?file=index.html
https://stackblitz.com/edit/vue-echarts-vue-2-global?file=index.html
vue-echarts![]() https://github.com/ecomfe/vue-echarts/blob/main/README.zh-Hans.md
https://github.com/ecomfe/vue-echarts/blob/main/README.zh-Hans.md


 2007
2007


 被折叠的 条评论
为什么被折叠?
被折叠的 条评论
为什么被折叠?
 到【灌水乐园】发言


