


调整前:
data(syn.net)
graph <- as(syn.net, "graphNEL")
plot(graph)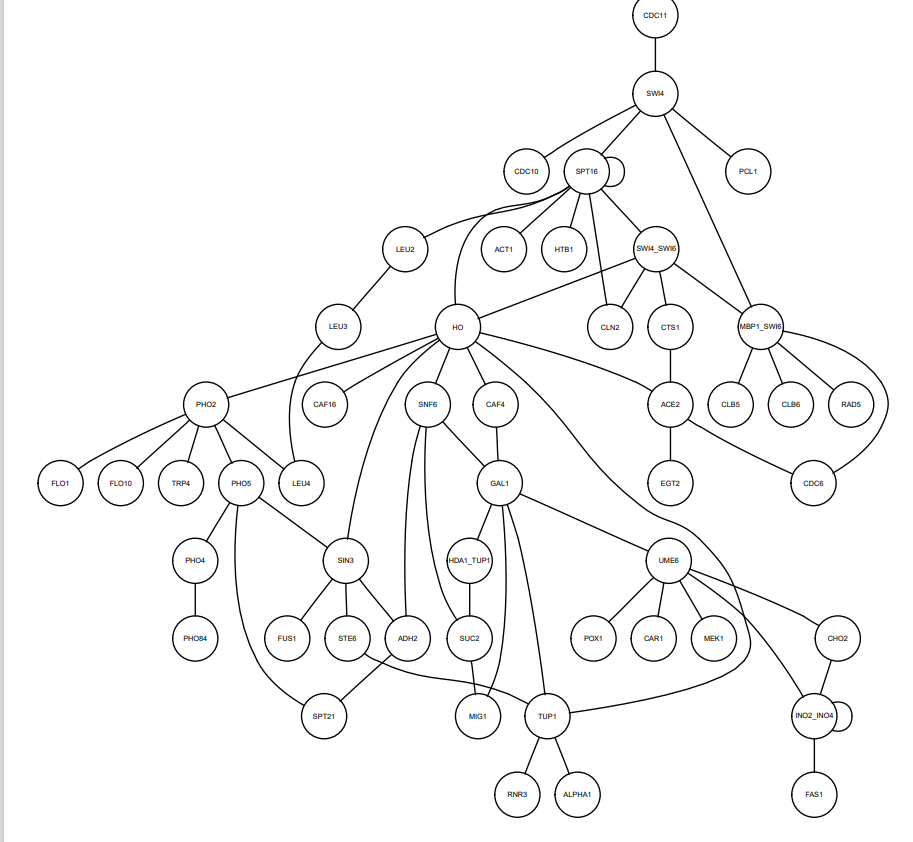
调整后:
attrs<-list()
attrs$node$fontsize<-20 #指定字体大小
plot(graph,attrs=attrs)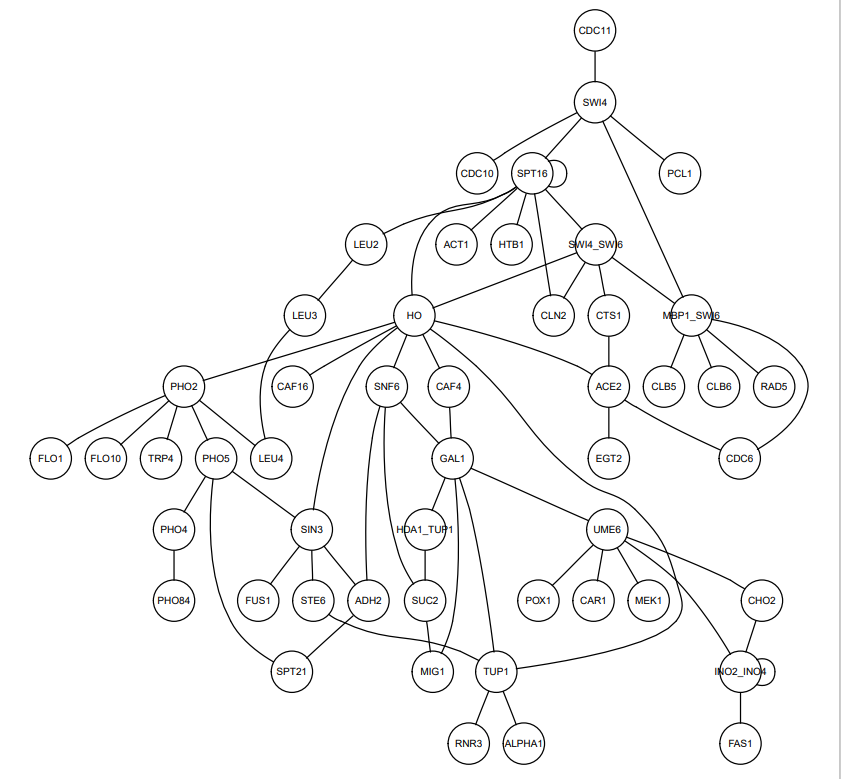
调整前:
data(syn.net)
graph <- as(syn.net, "graphNEL")
plot(graph)调整后:
attrs<-list()
attrs$node$fontsize<-20 #指定字体大小
plot(graph,attrs=attrs)


 被折叠的 条评论
为什么被折叠?
被折叠的 条评论
为什么被折叠?
 到【灌水乐园】发言


 978
978


