


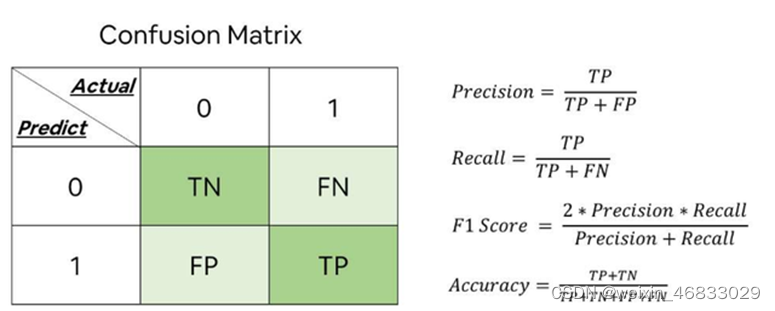
 这篇博客介绍了如何使用混淆矩阵来评估二分类和多分类模型的性能。混淆矩阵用于衡量模型预测正确和错误的情况,包括真阳性、真阴性、假阳性和假阴性。文章提供了Python代码示例,展示了如何绘制混淆矩阵,并通过`sklearn.metrics.confusion_matrix`函数计算矩阵,以及自定义函数`plot_confusion_matrix`来可视化结果。示例中展示了从独热编码到类别预测的不同情况。
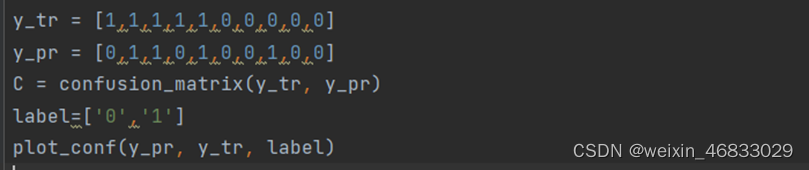
第一种情况:y_tr和y_pr都是独热码
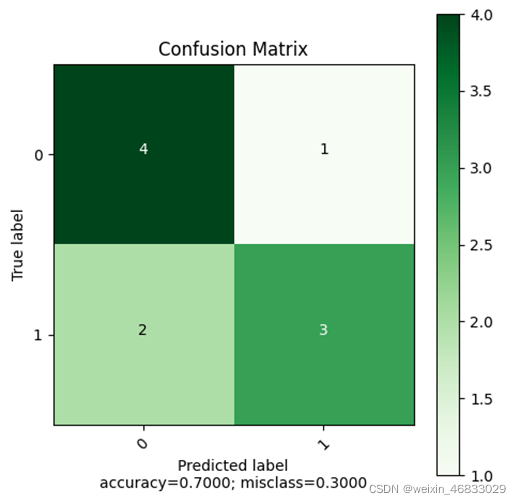
这种情况下,0和1两种类别只能被预测为0或者1。
即关注“是”还是“否”
混淆矩阵形如下图:为了统计0和1 预测正确的准确程度
调用(举个例子):
绘制结果:
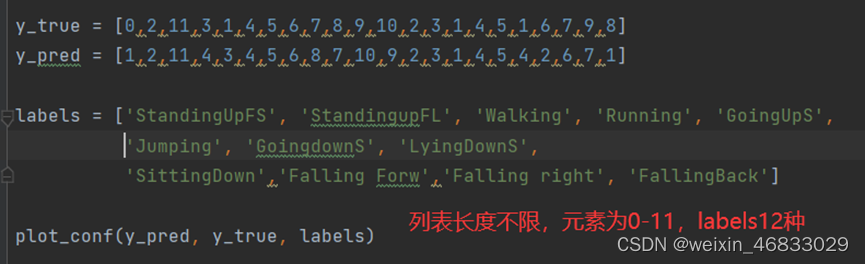
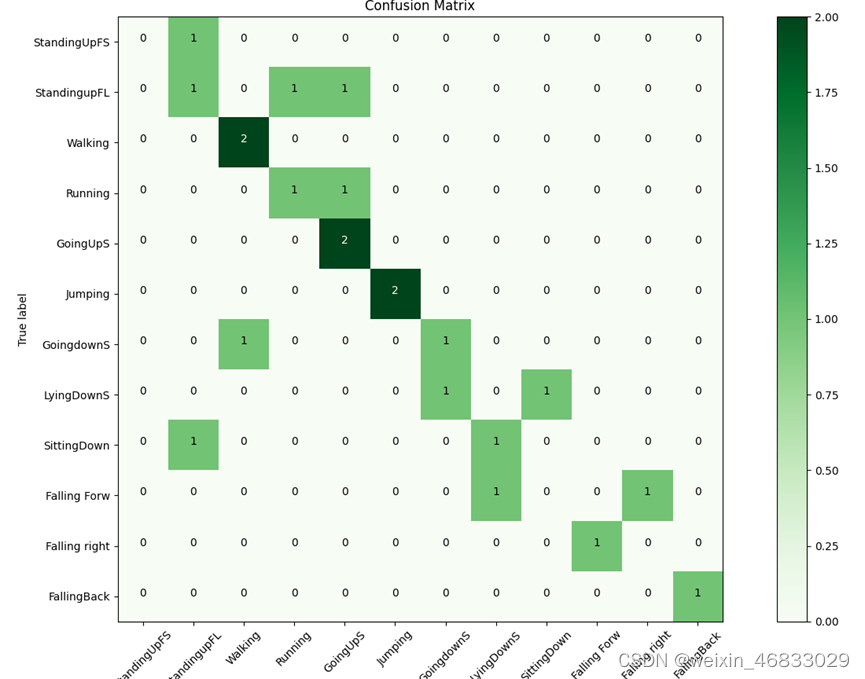
第二种:y_tr和y_pr是预测类别
这种情况下,每一个类别被可以预测为labels列表中的其他任何类别
即关注“该类是什么”
混淆矩阵用来统计该类被预测为12种类别中的个数,颜色越深代表该类预测到的个数越多。
调用(举个例子):
绘制结果:
附代码:不同类别画的时候可以调整下figsize大小
from sklearn.metrics import confusion_matrix
import matplotlib.pyplot as plt
import numpy as np
import itertools

def plot_confusion_matrix(cm,
                          target_names,
                          title='Confusion matrix',
                          cmap=plt.cm.Greens,
                          normalize=True):
    accuracy = np.trace(cm) / float(np.sum(cm))
    misclass = 1 - accuracy

    if cmap is None:
        cmap = plt.get_cmap('Blues')

    plt.figure(figsize=(5, 5))   # (15,12)
    plt.imshow(cm, interpolation='nearest', cmap=cmap)
    plt.title(title)
    plt.colorbar()

    if target_names is not None:
        tick_marks = np.arange(len(target_names))
        plt.xticks(tick_marks, target_names, rotation=45)
        plt.yticks(tick_marks, target_names)

    if normalize:
        cm = cm.astype('float') / cm.sum(axis=1)[:, np.newaxis]

    thresh = cm.max() / 1.5 if normalize else cm.max() / 2
    for i, j in itertools.product(range(cm.shape[0]), range(cm.shape[1])):
        if normalize:
            plt.text(j, i, "{:0.4f}".format(cm[i, j]),
                     horizontalalignment="center",
                     color="white" if cm[i, j] > thresh else "black")
        else:
            plt.text(j, i, "{:,}".format(cm[i, j]),
                     horizontalalignment="center",
                     color="white" if cm[i, j] > thresh else "black")

    plt.tight_layout()
    plt.ylabel('True label')
    plt.xlabel('Predicted label\naccuracy={:0.4f}; misclass={:0.4f}'.format(accuracy, misclass))
    # plt.savefig('./confusionmatrix350.png',dpi=350)  # dpi分辨率
    plt.show()

def plot_conf(y_pre, y_val,labels):
    conf_mat = confusion_matrix(y_true=y_val, y_pred=y_pre)
    print(conf_mat)
    plot_confusion_matrix(conf_mat, normalize=False, target_names=labels, title='Confusion Matrix')


# #-------- y_tr 和 y_pr 表示预测类别 -----------
# y_true = [0,2,11,3,1,4,5,6,7,8,9,10,2,3,1,4,5,1,6,7,9,8]
# y_pred = [1,2,11,4,3,4,5,6,8,7,10,9,2,3,1,4,5,4,2,6,7,1]
# labels = ['StandingUpFS', 'StandingupFL', 'Walking', 'Running', 'GoingUpS',
#           'Jumping', 'GoingdownS', 'LyingDownS',
#           'SittingDown','Falling Forw','Falling right', 'FallingBack']
# plot_conf(y_pred, y_true, labels)

#-------- y_tr 和 y_pr 都是独热码 -----------
y_tr = [1,1,1,1,1,0,0,0,0,0]
y_pr = [0,1,1,0,1,0,0,1,0,0]
C = confusion_matrix(y_tr, y_pr)
label=['0','1']
plot_conf(y_pr, y_tr, label)


 被折叠的 条评论
为什么被折叠?
被折叠的 条评论
为什么被折叠?
 到【灌水乐园】发言


