


Promethus(普罗⽶修斯)监控系统
- 能够安装prometheus服务器
- 能够通过安装node_exporter监控远程linux
- 能够通过安装mysqld_exporter监控远程mysql数据库
- 能够安装grafana
- 能够在grafana添加prometheus数据源
- 能够在grafana添加监控cpu负载的图形
- 能够在grafana图形显示mysql监控数据
Promethus官网介绍:
概叙
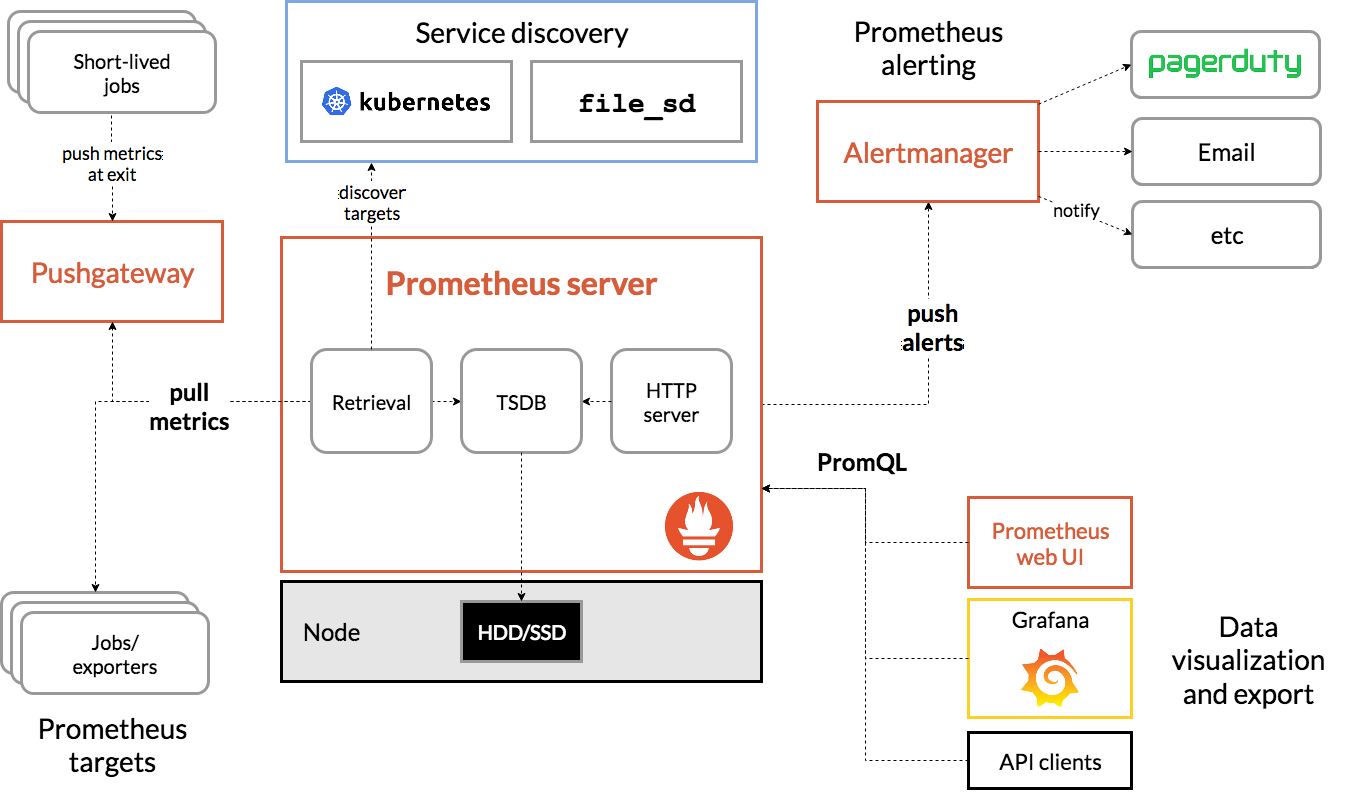
Prometheus(由go语言(golang)开发)是一套开源的监控&报警&时间序列数据库的组合。适合监控docker容器。因为kubernetes(俗称k8s)的流行带动了prometheus的发展。
时间序列数据
时间序列数据(TimeSeries Data) : 按照时间顺序记录系统、设备状态变化的数据被称为时序数据。
特点
-
性能好
关系型数据库对于大规模数据的处理性能糟糕。NOSQL可以比较好的处理大规模数据,让依然比不上时间序列数据库。
-
成本低
环境设置
| 名称 | ip | 主机名 |
|---|---|---|
| Grafana | 10.0.0.30 | Grafana |
| Prometheus | 10.0.0.20 | prometheus |
1.部署
下载地址
下载相应版本,安装到服务器上官网提供的是二进制版,解压就能用,不需要编译。


1)安装流程
#安装
[root@pro ~]# wget https://github.com/prometheus/prometheus/releases/download/v2.25.2/prometheus-2.25.2.linux-amd64.tar.gz
[root@pro ~]# ll
总用量 64732
-rw-------. 1 root root     1701 3月  29 15:52 anaconda-ks.cfg
-rw-r--r--  1 root root 66277199 3月  17 04:25 prometheus-2.25.2.linux-amd64.tar.gz
-rwxr-xr-x. 1 root root      195 3月  29 16:11 rewrite.sh

#解压
[root@pro ~]# tar xf prometheus-2.25.2.linux-amd64.tar.gz -C /usr/local/
[root@pro ~]# cd  /usr/local/prometheus-2.25.2.linux-amd64/
[root@pro prometheus-2.25.2.linux-amd64]# ll
总用量 167980
drwxr-xr-x 2 3434 3434       38 3月  17 04:20 console_libraries
drwxr-xr-x 2 3434 3434      173 3月  17 04:20 consoles
-rw-r--r-- 1 3434 3434    11357 3月  17 04:20 LICENSE
-rw-r--r-- 1 3434 3434     3420 3月  17 04:20 NOTICE
-rwxr-xr-x 1 3434 3434 91044140 3月  17 02:10 prometheus
-rw-r--r-- 1 3434 3434      926 3月  17 04:20 prometheus.yml
-rwxr-xr-x 1 3434 3434 80944687 3月  17 02:12 promtool
2)配置path变量
[root@pro local]# vim /etc/profile
export PROMETHEUS_HOME=/usr/local/prometheus-2.25.2.linux-amd64/
PATH=$PATH:$PROMETHEUS_HOME:/bin
export PATH
在命令行执行
[root@pro local]# source /etc/profile
3)配置文件
[root@pro prometheus-2.25.2.linux-amd64]# vim prometheus.yml
# my global config     ###监控的频率
global:
  scrape_interval:     15s # Set the scrape interval to every 15 seconds. Default is every 1 minute.
  evaluation_interval: 15s # Evaluate rules every 15 seconds. The default is every 1 minute.
  # scrape_timeout is set to the global default (10s).

# Alertmanager configuration    ##监控的报警
alerting:
  alertmanagers:
  - static_configs:
    - targets:
      # - alertmanager:9093

# Load rules once and periodically evaluate them according to the global 'evaluation_interval'.
rule_files:   ###配置权限
  # - "first_rules.yml"
  # - "second_rules.yml"

# A scrape configuration containing exactly one endpoint to scrape:
# Here it's Prometheus itself.
scrape_configs:  ##配置监控项
  # The job name is added as a label `job=<job_name>` to any timeseries scraped from this config.
  - job_name: 'prometheus'

    # metrics_path defaults to '/metrics'
    # scheme defaults to 'http'.

    static_configs:
    - targets: ['localhost:9090']
4)启动
查看prometheus的帮助命令
[root@pro prometheus-2.25.2.linux-amd64]# prometheus -h
###指定配置文件并启动
[root@pro prometheus-2.25.2.linux-amd64]# ./prometheus  --config.file="prometheus.yml"
5)访问

6)测试:添加 一个监控项查看

补充:可以查看监控的主机

2.配置多台监控的主机
1.安装node_exporter机器指令
1)在远程linux主机(被监控端agent1)上安装node_exporter机器指
[root@agent ~] wget https://github.com/prometheus/node_exporter/releases/download/v1.1.1/node_exporter-1.1.1.linux-amd64.tar.gzwget https://github.com/prometheus/node_exporter/releases/download/v1.1.1/node_exporter-1.1.1.linux-amd64.tar.gz
[root@agent ~]# rz -E
rz waiting to receive.
[root@agent ~]# ll
总用量 9036
-rw-------. 1 root root    1701 3月  29 15:52 anaconda-ks.cfg
-rw-r--r--  1 root root 9242615 6月  16 11:20 node_exporter-1.1.1.linux-amd64.tar.gz
-rwxr-xr-x. 1 root root     195 3月  29 16:11 rewrite.sh
##解压
[root@agent ~]# tar xf node_exporter-1.1.1.linux-amd64.tar.gz -C /usr/local/
[root@agent ~]# cd /usr/local/node_exporter-1.1.1.linux-amd64/
[root@agent node_exporter-1.1.1.linux-amd64]# ll
总用量 18740
-rw-r--r-- 1 3434 3434    11357 2月  13 21:42 LICENSE
-rwxr-xr-x 1 3434 3434 19170241 2月  13 21:31 node_exporter
-rw-r--r-- 1 3434 3434      463 2月  13 21:42 NOTICE
#启动
[root@agent node_exporter-1.1.1.linux-amd64]# ./node_exporter
或者:
 nohup /usr/local/node_exporter-1.1.1/node_exporter &


参数:
	--web.listen-address=":9100" 	#修改默认端口,防止冲突
	--web.telemetry-path="/metrics" #获取metric信息的url,默认是/metrics,若需要修改则通过此参数
    --log.level="info" 			    #设置日志级别
    --log.format="logger:stderr"     #设置打印日志的格式,若有自动化日志提取工具可以使用这个参数规范日志打印的格式
system管理node_exporter
echo "3. 建立超链接"
ln -s /usr/local/node_exporter-1.1.2.linux-amd64/ /usr/local/node_exporter &&\

echo "4.创建systemd服务"
cat > /etc/systemd/system/node_exporter.service <<EOF
[Unit]
Description=This is prometheus node exporter
After=node_exporter.service

[Service]
Type=simple
ExecStart=/usr/local/node_exporter/node_exporter
ExecReload=/bin/kill -HUP
KillMode=process
Restart=on-failure

[Install]
WantedBy=multi-user.target
EOF

echo "5.启动node_exporter服务"
systemctl daemon-reload &&\
systemctl enable --now node_exporter.service
2.配置prometheus的配置文件
[root@pro]# vim prometheus.yml
  - job_name: 'agent'
    static_configs:
    - targets: ['10.0.0.130:9100,10.0.0.30:9100']
3.启动
[root@pro]# pkill prometheus
[root@pro prometheus-2.25.2.linux-amd64]# ./prometheus  --config.file="prometheus.yml"
4.访问
回到web管理界面 --> 点Status --> 点Targets --> 可以看到多了一台监控目标

补充:查看磁盘的命令
[root@agent ~]# lsblk
NAME            MAJ:MIN RM  SIZE RO TYPE MOUNTPOINT
sda               8:0    0   10G  0 disk
├─sda1            8:1    0  500M  0 part /boot
└─sda2            8:2    0  9.5G  0 part
  ├─centos-root 253:0    0  8.5G  0 lvm  /
  └─centos-swap 253:1    0 1000M  0 lvm  [SWAP]
sr0              11:0    1  792M  0 rom
[root@agent ~]# df -h
文件系统                 容量  已用  可用 已用% 挂载点
devtmpfs                 475M     0  475M    0% /dev
tmpfs                    487M     0  487M    0% /dev/shm
tmpfs                    487M  7.1M  480M    2% /run
tmpfs                    487M     0  487M    0% /sys/fs/cgroup
/dev/mapper/centos-root  8.6G  2.1G  6.6G   24% /
/dev/sda1                497M  149M  349M   30% /boot
tmpfs                     98M     0   98M    0% /run/user/0
pv : 页面浏览量 6千万
uv : 独立用户浏览量 3~4千
QPS :每秒查询率 5~10万
3.监控数据库服务
1.安装mysqld_exporter插件
[root@db01 ~]# wget https://github.com/prometheus/mysqld_exporter/releases/download/v0.12.1/mysqld_exporter-0.12.1.linux-amd64.tar.gz

[root@agent ~]# ll
rw-r--r--  1 root root 7121565 7月  29 2019 mysqld_exporter-0.12.1.linux-amd64.tar.gz
-rwxr-xr-x. 1 root root     195 3月  29 16:11 rewrite.sh
#解压
[root@db01 ~]# tar xf mysqld_exporter-0.12.1.linux-amd64.tar.gz -C /usr/local/
[root@db01 ~]# cd /usr/local/
[root@db01 local]# ll
总用量 0
drwxr-xr-x. 2 root root  6 11月  5 2016 bin
drwxr-xr-x. 2 root root  6 11月  5 2016 etc
drwxr-xr-x. 2 root root  6 11月  5 2016 games
drwxr-xr-x. 2 root root  6 11月  5 2016 include
drwxr-xr-x. 2 root root  6 11月  5 2016 lib
drwxr-xr-x. 2 root root  6 11月  5 2016 lib64
drwxr-xr-x. 2 root root  6 11月  5 2016 libexec
drwxr-xr-x  2 3434 3434 58 7月  29 2019 mysqld_exporter-0.12.1.linux-amd64
drwxr-xr-x. 2 root root  6 11月  5 2016 sbin
drwxr-xr-x. 5 root root 49 3月  29 15:47 share
drwxr-xr-x. 2 root root  6 11月  5 2016 src
[root@db01 local]# cd /usr/local/mysqld_exporter-0.12.1.linux-amd64/
#查看
[root@db01 mysqld_exporter-0.12.1.linux-amd64]# ll
总用量 14484
-rw-r--r-- 1 3434 3434    11325 7月  29 2019 LICENSE
-rwxr-xr-x 1 3434 3434 14813452 7月  29 2019 mysqld_exporter
-rw-r--r-- 1 3434 3434       65 7月  29 2019 NOTICE
2.安装数据库
1)创建安装目录
[root@db01 ~]# mkdir /app
2)解压并改名
[root@db01 app]# tar xf mysql-5.7.20-linux-glibc2.12-x86_64.tar.gz

[root@db01 app]# mv mysql-5.7.20-linux-glibc2.12-x86_64 mysql
[root@db01 app]# ll
总用量 626104
drwxr-xr-x 9 root root       129 6月  11 22:28 mysql
-rw-r--r-- 1 root root 641127384 6月  16 2021 mysql-5.7.20-linux-glibc2.12-x86_64.tar.gz
3)修改环境变量
[root@db01 app]# vim /etc/profile
export PATH=/app/mysql/bin:$PATH
[root@db01 app]# source /etc/profile
4)创建mysql用户和组(如果已有可忽略)
[root@db01 app]# useradd mysql
#查看
[root@db01 app]# vim /etc/passwd
[root@db01 app]# vim /etc/group
5)创建相关数据目录并授权
[root@db01 app]# mkdir /data/mysql -p
[root@db01 app]# chown -R mysql.mysql /app/*
[root@db01 app]# chown -R mysql.mysql /data/*
6)初始化数据,初始化管理员的密码为空
[root@db01 mysql]# \rm -rf  /data/mysql/*
[root@db01 mysql]# mysqld --initialize-insecure  --user=mysql --basedir=/app/mysql --datadir=/data/mysql
2021-08-06T08:49:16.976210Z 0 [Warning] TIMESTAMP with implicit DEFAULT value is deprecated. Please use --explicit_defaults_for_timestamp server option (see documentation for more details).
2021-08-06T08:49:17.346157Z 0 [Warning] InnoDB: New log files created, LSN=45790
2021-08-06T08:49:17.396043Z 0 [Warning] InnoDB: Creating foreign key constraint system tables.
2021-08-06T08:49:17.456154Z 0 [Warning] No existing UUID has been found, so we assume that this is the first time that this server has been started. Generating a new UUID: 2f073dfb-f693-11eb-882f-000c2996a31f.
2021-08-06T08:49:17.457110Z 0 [Warning] Gtid table is not ready to be used. Table 'mysql.gtid_executed' cannot be opened.
2021-08-06T08:49:17.458371Z 1 [Warning] root@localhost is created with an empty password ! Please consider switching off the --initialize-insecure option.
[root@db01 mysql]# cd /data/mysql/
[root@db01 mysql]# ll
总用量 110628
-rw-r----- 1 mysql mysql       56 8月   6 16:49 auto.cnf
-rw-r----- 1 mysql mysql      419 8月   6 16:49 ib_buffer_pool
-rw-r----- 1 mysql mysql 12582912 8月   6 16:49 ibdata1
-rw-r----- 1 mysql mysql 50331648 8月   6 16:49 ib_logfile0
-rw-r----- 1 mysql mysql 50331648 8月   6 16:49 ib_logfile1
drwxr-x--- 2 mysql mysql     4096 8月   6 16:49 mysql
drwxr-x--- 2 mysql mysql     8192 8月   6 16:49 performance_schema
drwxr-x--- 2 mysql mysql     8192 8月   6 16:49 sys
7)书写配置文件
[mysqld]
user=mysql
basedir=/app/mysql
datadir=/data/mysql
server_id=6
port=3306
socket=/tmp/mysql.sock
[mysql]
socket=/tmp/mysql.sock
prompt=3306 [\\d]>
8)使用systemd管理mysql
#配置
[root@db01 support-files]# vim /etc/systemd/system/mysqld.service
[Unit]
Description=MySQL Server
Documentation=man:mysqld(8)
Documentation=http://dev.mysql.com/doc/refman/en/using-systemd.html
After=network.target
After=syslog.target
[Install]
WantedBy=multi-user.target
[Service]
User=mysql
Group=mysql
ExecStart=/app/mysql/bin/mysqld --defaults-file=/etc/my.cnf
LimitNOFILE = 5000
#启动mysql
[root@db01 support-files]# systemctl start mysqld.service
9)安装后的简单管理
[root@db01 support-files]# mysqladmin -uroot -p password 123
Enter password: ###直接回车
mysqladmin: [Warning] Using a password on the command line interface can be insecure.
Warning: Since password will be sent to server in plain text, use ssl connection to ensure password safety.
[root@db01 mysql]# mysql -uroot -p123
创建用户
3306 [(none)]>create user exporter@'%' identified by '123';
创建用户并授权
3306 [(none)]>grant select,replication client,process on *.* to exporter@'%';
Query OK, 0 rows affected, 1 warning (0.00 sec)
刷新
3306 [(none)]>flush privileges;
Query OK, 0 rows affected (0.00 sec)

3306 [(none)]>exit

3306 [(none)]>select user,host from mysql.user;
+---------------+-----------+
| user          | host      |
+---------------+-----------+
| exporter      | %         |
| mysql.session | localhost |
| mysql.sys     | localhost |
| root          | localhost |
+---------------+-----------+
十)、创建一个mysql配置文件,写上连接的用户名与密码(和上面的授权的用户名 和密码要对应)
(注意:授权ip为localhost,因为不是prometheus服务器来直接找mariadb 获取数据,而是prometheus服务器找mysql_exporter,mysql_exporter 再找mariadb。所以这个localhost是指的mysql_exporter的IP
# 创建一个mysql配置文件,写上连接的用户名与密码(和上面的授权的用户名 和密码要对应)
[root@db01 mysqld_exporter-0.12.1]# vim /usr/local/mysqld_exporter-0.12.1/.my.cnf
[client]
user=exporter
password=123
# 启动mysqld_exporter
[root@db01 mysqld_exporter-0.12.1]#/usr/local/mysqld_exporter-0.12.1/mysqld_exporter --config.my-cnf=/usr/local/mysqld_exporter-0.12.1/.my.cnf
后者:
nohup /usr/local/mysqld_exporter-0.12.1/mysqld_exporter --config.my-cnf=/usr/local/mysqld_exporter-0.12.1/.my.cnf &

#查看端口(9104)
#修改prometheus的配置文件
[root@pro prometheus-2.25.2.linux-amd64]# vim prometheus.yml

  - job_name: 'db_01'
    static_configs:
    - targets: ['10.0.0.50:9104']
  #启动prometheus
  [root@pro prometheus-2.25.2.linux-amd64]# ./prometheus --config.file="prometheus.yml"
  后者:
  /usr/local/prometheus-2.25.0/prometheus --config.file="/usr/local/prometheus-2.25.0/prometheus.yml" &
测试访问:

补充:创建systemd管理mysqld_exporter.service服务
cat >> /usr/lib/systemd/system/mysqld_exporter.service <<EOF
[Unit]
Description=Prometheus

[Service]
Environment=DATA_SOURCE_NAME=root:123@(172.16.1.50:3306)/
ExecStart=/usr/local/mysqld_exporter/mysqld_exporter --config.my-cnf=/usr/local/mysqld_exporter/.my.cnf --web.listen-address=:9104
Restart=on-failure

[Install]
WantedBy=multi-user.target
EOF

echo "6.启动node_exporter服务"
systemctl daemon-reload &&\
systemctl enable --now mysqld_exporter.service
Grafana
什么是Grafana
Grafana是一个开源的度量分析和可视化工具,可以通过将采集的数据分析,查询,然后进行可视化的展示,并能实现报警。
使用Grafana连接Prometheus
1.在grafana服务器上安装grafana。
[root@gfa ~]# wget https://dl.grafana.com/oss/release/grafana-7.4.3-1.x86_64.rpm
#yum安装
[root@gfa ~]# yum install -y grafana-7.4.3-1.x86_64.rpm
#启动
[root@gfa ~]# systemctl start grafana-server.service
默认监控3000
浏览器访问ip+端口
默认密码:admin
2.访问测试

3.生成prometheus数据源


4.查看

5.生成图表

6.保存之后可以在首页看见,需要什么添加什么,右上角的add键

7.结果

8.Grafana图形显示MySQL监控数据
1)在grafana上修改配置文件,并下载安装mysql监控的dashboard(包含相关json文件,这些json文件可以看作是开发人员开发的一个监控模板)
#1.下载mysql监控的dashboard
[root@gfa ~]# git clone https://github.com/percona/grafana-dashboards.git


#2.修改grafana的配置文件
[root@gfa ~]# vim /etc/grafana/grafana.ini
在最后添加
[dashboards.json]
enabled=true
path=/var/lib/grafana/dashboards
#3.将下载的mysql监控的dashboard里的所有内容移动到创建的dashboards下
[root@gfa ~]# mkdir -p  /var/lib/grafana/dashboards
[root@gfa ~]# cd /var/lib/grafana/dashboards/
[root@gfa dashboards]# cd ..
[root@gfa grafana]#

[root@gfa  grafana]# mv /root/grafana-dashboards/ .
[root@gfa  grafana]# ll
总用量 0
drwxr-xr-x 2 root root   6 4月  18 21:07 dashboards
drwxr-xr-x 8 root root 272 4月  23 2021 grafana-dashboards
[root@gfa  grafana]# mv grafana-dashboards/dashboards/* dashboards/
[root@gfa  grafana]# cd dashboards/
[root@gfa dashboards]# ll  #查看所有json文件
总用量 9932
-rw-r--r-- 1 root root   24679 4月  23 2021 Advanced_Data_Exploration.json
-rw-r--r-- 1 root root   76839 4月  23 2021 CPU_Utilization_Details.json
-rw-r--r-- 1 root root  100017 4月  23 2021 Disk_Details.json


#4重启
[root@gfa grafana]# systemctl restart grafana-server.service
2)导入json----可以上传,也可以手动复制

安装插件:
grafana-cli plugins install digiapulssi-breadcrumb-panel
补充:grafana 二进制安装
[root@gfa ~]# wget https://dl.grafana.com/oss/release/grafana-7.4.3-1.x86_64.rpm
[root@gfa ~]# sudo yum install grafana-7.4.3-1.x86_64.rpm
[root@gfa ~]# tar xf grafana-7.4.3.linux-amd64.tar_\(2\).gz -C /usr/local/

#2.添加环境变量
[root@gfa ~]## vim /etc/profile
export GAFANA_HOME=/usr/local/grafana-7.4.3
PATH=$PATH:$GAFANA_HOME/bin
export PATH
[[root@gfa grafana-7.4.3]# source /etc/profile

#3.启动
[root@gfa grafana-7.4.3]# grafana-server
默认监控3000
浏览器访问ip+端口
默认密码:admin
#4.重新启动
[root@gdx2 lib]# cd /usr/local/grafana-7.4.3/
[root@gdx2 grafana-7.4.3]# ll
总用量 28
drwxr-xr-x  2 root root    96 2月  24 19:56 bin
drwxr-xr-x  3 root root   107 4月  18 21:06 conf
[root@gdx2 grafana-7.4.3]# grafana-server  -config ./conf/defaults.ini


 1203
1203


 被折叠的 条评论
为什么被折叠?
被折叠的 条评论
为什么被折叠?
 到【灌水乐园】发言


