


 本文详细介绍了如何使用Zabbix监控Linux主机,包括安装Zabbix客户端、配置文件,以及自定义监控的过程,如添加主机、关联模板,自定义键值和触发器,以及创建和应用自定义模板。
一、监控任意主机流程
- 安装Zabbix客户端和修改配置文件
# 安装yum源
root@node1:/# rpm -ivh https://mirrors.aliyun.com/zabbix/zabbix/6.0/rhel/7/x86_64/zabbix-release-6.0-2.el7.noarch.rpm

# 安装 zabbix-agent2
root@node1:/ # yum -y install zabbix-agent2

# 配置客户端
root@node1:/# vim /etc/zabbix/zabbix_agent2.conf
Server=192.168.100.4# 地址改为zabbix服务端地址即可

# 启动zabbix客户端
root@node1:/# systemctl start zabbix-agent2
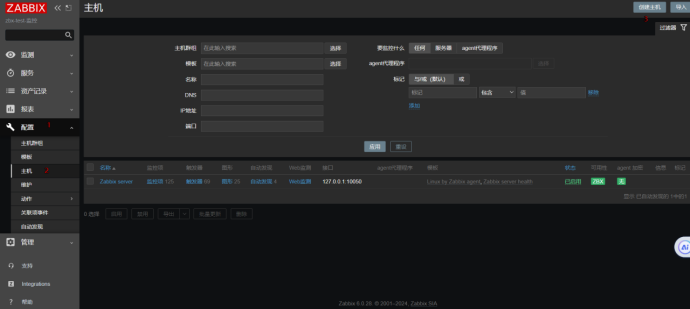
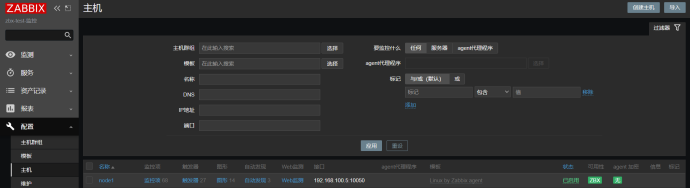
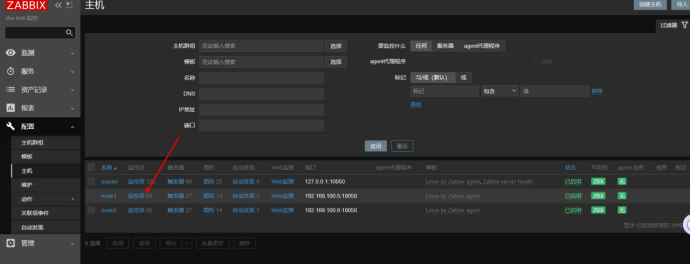
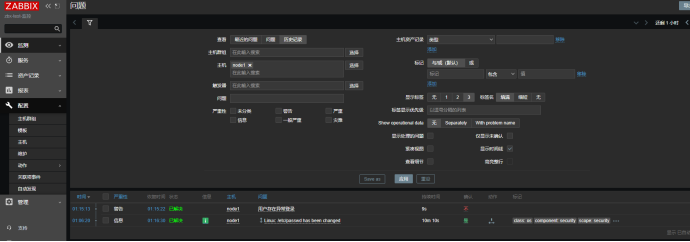
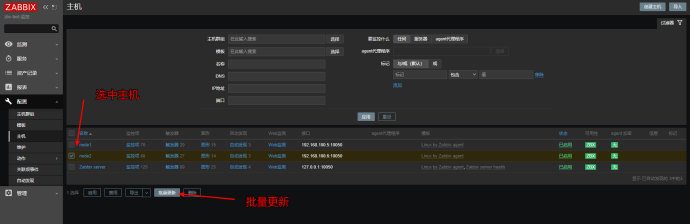
- Zabbix web页面添加主机,关联模板

二、自定义监控
1. 概述
- 通过zabbix客户端 + 各种模板实现监控
- zabbix by linux agent模板可以监控的内容:
- 磁盘
- CPU
- 内存,SWAP
- 网络,网卡
- 系统负载
- 进程数量
- 用户登录数
- 系统运行时长
2. 自定义监控应用场景
- 模板中没有我们所要的监控项
- 默认模板中监控项过多
3. 自定义监控全流程
| 步骤 | 流程 | |
|---|---|---|
| 客户端 | 通过命令、脚本取出对应的值 | |
| 根据zbx的要求,按照格式,书写配置文件,创建键值 | 键值key用于获取客户端数据 | |
| 重启客户端服务,测试键值是否可使用 | ||
| 服务端 | 服务端测试键值是否可用 | |
| web页面,键值与监控项关联 | ||
| web页面测试 | ||
| 图形 | ||
| 触发器 | 是否发出警报,根据情况设置 |
3.1. 客户端
A. 通过命令、脚本取出对应的值
目标:实现自定义监控80端口

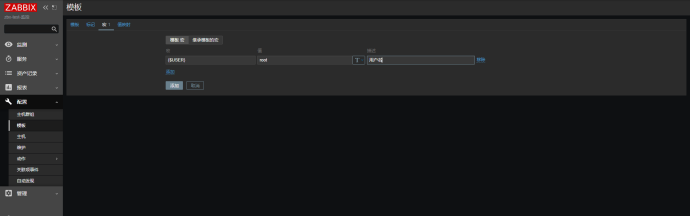
B. 创建键值
UserParameter=key,cmd
UserParameter=固定的格式,表示要自定义键值
key表示键值名字,命名最好见名知意,多个单词用.隔开
cmd表示命令或脚本
# 1. 写入自定义key(键值)
vim /etc/zabbix/zabbix_agent2.d/web_nginx.conf
#UserParameter=key,cmd
#UserParameter=check.nginx,sh /server/xxx.sh
UserParameter=check.nginx,ss -ntulp4 | grep -w 80 | wc -l

# 2.重启客户端
systemctl restart zabbix-agent2

# 3. 本地测试
zabbix_agent2 -t check.nginx
check.nginx                                   [s|1]
3.2 服务端
A. Zabbix服务端手动测试
# 1. 下载软件
 yum -y install zabbix-get
 # zabbix-get  向客户端要指定的数据
root@master:/root # zabbix_get -s 192.168.100.5 -p 10050 -k check.nginx
1
root@master:/root # zabbix_get -s 192.168.100.5 -p 10050 -k system.hostname
node1
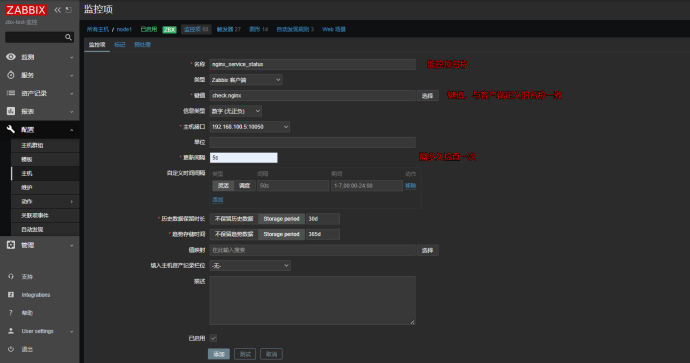
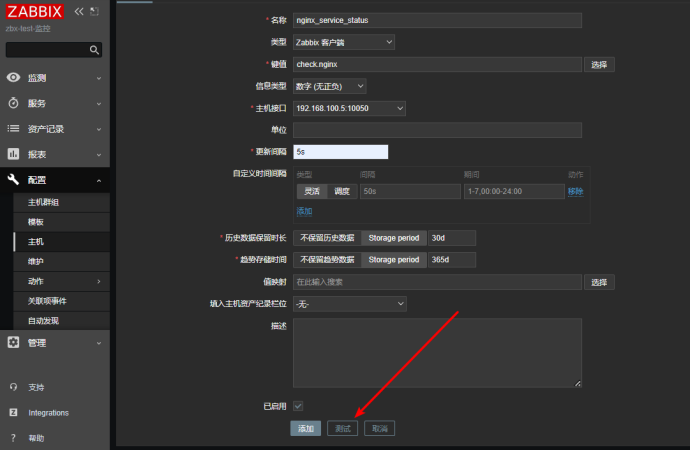
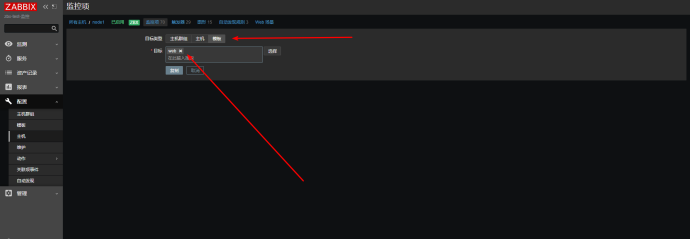
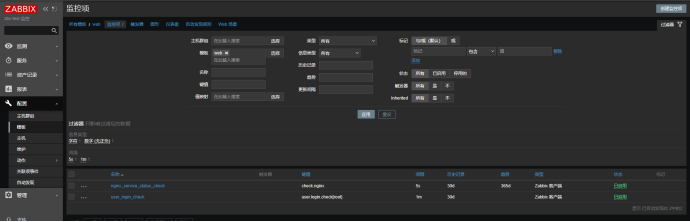
B. 创建监控项
将客户端创建的键值与服务端的监控项关联


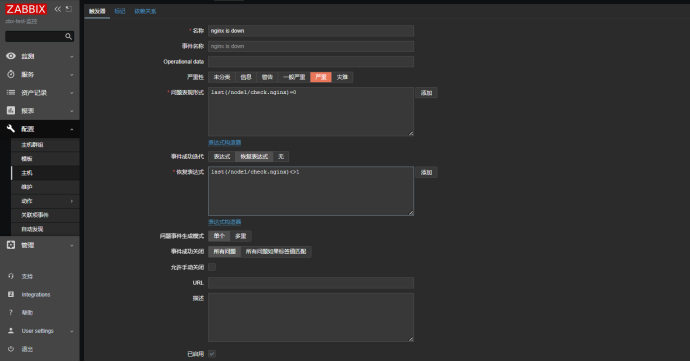
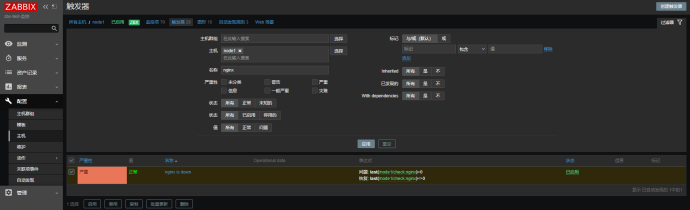
C. 触发器
根据监控项获取的数值,决定是否告警


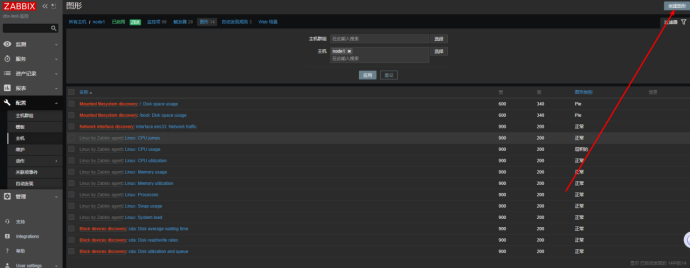
D. 创建图形
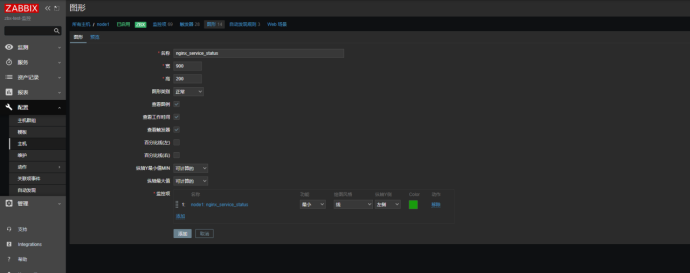
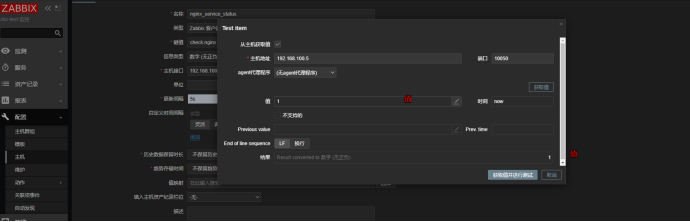
D. 测试
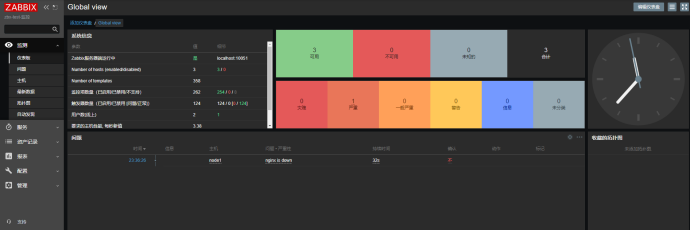
# 1. 关闭nginx
pkill nginx
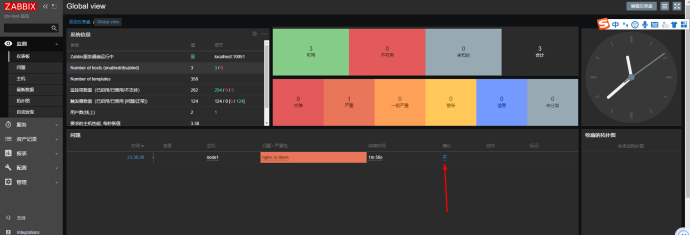
- 查看zabbix web页面
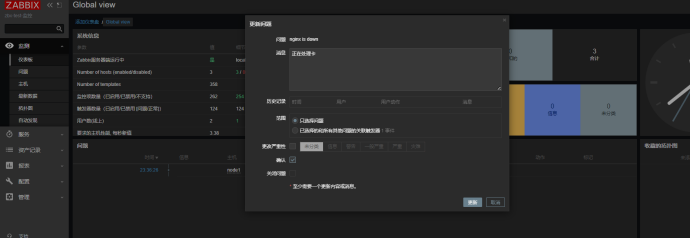
- 正在处理问题,告知Zabbix不需要提示告警
4 常用键值和触发器函数
4.1 键值
| 键值 | 名称 |
|---|---|
| agent.hostmetadata | Agent主机元数据。返回字符串 |
| agent.hostname | 客户端主机名。返回字符串 |
| agent.ping | 客户端可达性检查。返回 nothing - 不可达;1 - 可达 |
| agent.variant | Agent类型检查。返回1 - Zabbix agent;2 - Zabbix agent2 |
| agent.version | zabbix客户端(agent)的版本。返回字符串 |
| kernel.maxfiles | 操作系统最大的文件打开数量。返回整数 |
| kernel.maxproc | 操作系统最大的进程数。返回整数 |
| kernel.openfiles | Number of currently open file descriptors. Returns integer |
| modbus.get[endpoint,,,,,,,] | Reads modbus data. Returns various types |
| net.dns.record[,name,,,,] | 执行DNS查询。返回字符串信息 |
| net.dns[,name,,,,] | 检查 DNS 服务是否开启。返回 0 - DNS 服务关闭(服务未响应或DNS解析失败);1 - DNS 服务开启 |
| net.if.collisions[if] | 网络冲突数量。返回整型 |
| net.if.discovery | List of network interfaces. Returns JSON |
| net.if.in[if,] | 网络接口上传流量统计。返回 整数 |
| net.if.list | 网络接口列表(包括接口类型,状态,IPv4地址,说明)。返回文本 |
| net.if.out[if,] | 上行流量统计。返回整数 |
| net.if.total[if,] | 网络接口上传下载的流量总和。返回整数 |
| net.tcp.listen[port] | 检查 TCP 端口 是否处于侦听状态。返回 0 - 未侦听;1 - 正在侦听 |
| net.tcp.port[,port] | 检查是否能建立 TCP 连接到指定端口。返回 0 - 不能连接;1 - 可以连接 |
| net.tcp.service.perf[service,,] | 检查 TCP 服务的性能,当服务 down 时返回 0,否则返回连接服务花费的秒数 |
| net.tcp.service[service,,] | 检查服务是否运行并接受 TCP 连接。返回 0 - 服务关闭;1 - 服务运行 |
| net.tcp.socket.count[,,,,] | Returns number of TCP sockets that match parameters. Returns integer |
| net.udp.listen[port] | 检查 UDP 端口 是否处于侦听状态。返回 0 - 未侦听;1 - 正在侦听 |
| net.udp.service.perf[service,,] | 检查 UDP 服务的性能,当服务 down 时返回 0,否则返回连接到服务花费的秒数 |
| net.udp.service[service,,] | 检查服务是否运行并响应 UDP 请求。返回 0 - 服务关闭;1 - 服务运行 |
| net.udp.socket.count[,,,,] | Returns number of UDP sockets that match parameters. Returns integer |
| perf_counter[counter,] | 所有Windows计数器值。返回 整形、浮点、字符串、文本 |
| perf_counter_en[counter,] | Value of any Windows performance counter in English. Returns integer, float, string or text (depending on the request) |
| perf_instance.discovery[object] | List of object instances of Windows performance counters. Returns JSON |
| perf_instance_en.discovery[object] | List of object instances of Windows performance counters, discovered using object names in English. Returns JSON |
| proc.cpu.util[,,,,,] | Process CPU utilization percentage. Returns float |
| proc.mem[,,,,] | 进程内存,以字节为单位。返回整数 |
| proc.num[,,,,] | 进程数。返回整数 |
| proc_info[process,,] | 具体处理的各个信息。返回浮点数 |
| sensor[device,sensor,] | 硬件传感器读数。返回浮点型 |
| service.info[service,] | 有关服务的信息。返回整数字段表示状态,启动状态;字符串 - 以字段作为显示名,路径,用户; 文本 - 使用字段作为描述; 状态码:0 - 运行,1 - 暂停,2 - 启动挂起,3 - 暂停挂起,4 - 继续挂起,5 - 停止挂起,6 - 停止,7 - 未知,255 - 没有这个服务;启动码:0 - 自动,1 - 自动延迟,2 - 手动, 3 - 禁用,4 - 未知 |
| services[,,] | 列表服务。返回0表示空,如果是列表则是每行一个内容 |
| system.boottime | 系统启动时间。返回时间戳 |
| system.cpu.discovery | List of detected CPUs/CPU cores. Returns JSON |
| system.cpu.intr | 设备的中断数。返回整数 |
| system.cpu.load[,] | CPU 负载。返回浮点数 |
| system.cpu.num[] | CPU 数量,返回整数 |
| system.cpu.switches | 上下文的数量进行切换。它返回一个整数值。 |
| system.cpu.util[,,,<logical_or_physical>] | CPU 使用率. 返回浮点数 |
| system.hostname[,] | 系统主机名。返回字符串 |
| system.hw.chassis[] | 机架信息。返回字符串 |
| system.hw.cpu[,] | CPU 信息。返回字符串或整数 |
| system.hw.devices[] | PCI或者USB设备列表。返回文本 |
| system.hw.macaddr[,] | MAC地址。返回字符串 |
| system.localtime[] | System time. Returns integer with type as UTC; string - with type as local |
| system.run[command,] | 即在主机上指定的命令的执行。返回命令执行结果的文本值。如果指定NOWAIT的模式,这将返回执行命令的结果1。 |
| system.stat[resource,] | 系统统计数据。返回整数值或者浮点值 |
| system.sw.arch | 软件架构信息。返回字符串 |
| system.sw.os[] | 操作系统信息。返回字符串 |
| system.sw.packages[,,] | 安装包列表。返回文本 |
| system.swap.in[,] | 在交换分区(swap)(从设备到内存)统计数据。返回整数 |
| system.swap.out[,] | 交换分区(从内存到设备)的统计数据。返回整数 |
| system.swap.size[,] | 交换分区空间大小,字节或从总百分比。从字节返回整数;对于浮动比例 |
| system.uname | 识别系统。返回 字符串 |
| system.uptime | 系统启动时间。返回整数 |
| system.users.num | 已登录的用户数量,返回整数 |
| vfs.dev.discovery | List of block devices and their type. Returns JSON |
| vfs.dev.read[,,] | 磁盘读取数据。类型是sectors, operations, bytes;返回整数,类型是 sps, ops, bps则返回浮点。 |
| vfs.dev.write[,,] | 磁盘写入数据。类型是sectors, operations, bytes;返回整数,类型是 sps, ops, bps则返回浮点。 |
| vfs.dir.count[dir,<regex_incl>,<regex_excl>,<types_incl>,<types_excl>,<max_depth>,<min_size>,<max_size>,<min_age>,<max_age>,<regex_excl_dir>] | 目录递归的条目数量。返回整数 |
| vfs.dir.get[dir,<regex_incl>,<regex_excl>,<types_incl>,<types_excl>,<max_depth>,<min_size>,<max_size>,<min_age>,<max_age>,<regex_excl_dir>] | List of directory entries, recursively. Returns JSON |
| vfs.dir.size[dir,<regex_incl>,<regex_excl>,,<max_depth>,<regex_excl_dir>] | 目录大小(bytes)。返回整数 |
| vfs.file.cksum[file,] | 文件校验,通过UNIX cksum算法进行检测,返回crc32数值(默认),md5字符串,sha256字符串 |
| vfs.file.contents[file,] | 搜索文件内容。返回文本 |
| vfs.file.exists[file,<types_incl>,<types_excl>] | Checks if file exists. Returns 0 - not found; 1 - file of the specified type exists |
| vfs.file.get[file] | Information about a file. Returns JSON |
| vfs.file.md5sum[file] | 文件的MD5校验。返回字符串(该文件的MD5哈希值) |
| vfs.file.owner[file,,] | 文件所有者信息。返回字符串 |
| vfs.file.permissions[file] | Returns 4-digit string containing octal number with Unix permissions |
| vfs.file.regexp[file,regexp,,,,] | 查找文件中的字符串,返回内容是被匹配内容的整行字符串,或者其他可选参数 |
| vfs.file.regmatch[file,regexp,,,] | 查找文件中的字符串,如果有则返回1,没有则返回0。 |
| vfs.file.size[file,] | 文件大小以字节(默认)或换行符为单位。返回整数 |
| vfs.file.time[file,] | 文件事件信息,返回的是时间戳 整数 |
| vfs.fs.discovery | List of mounted filesystems and their types. Returns JSON |
| vfs.fs.get | List of mounted filesystems, their types, disk space and inode statistics. Returns JSON |
| vfs.fs.inode[fs,] | 数或inode的百分比。返回数字,如果是浮点则是百分比 |
| vfs.fs.size[fs,] | 磁盘容量。如果返回的是字节则是整数,如果返回的是百分比则是浮点。 |
| vm.memory.size[] | 从字节或总百分比的内存大小。它返回一个整数值,如果字节,只要百分比返回浮点值。 |
| vm.vmemory.size[] | 虚拟空间大小(以字节计)或百分比(总计)。 返回整型字节; 浮点百分比 |
| web.page.get[host,
| 获取网页。返回信息为网页源码或者TXT |
| web.page.perf[host,
| 全网页加载时间(秒)。返回浮点型 |
| web.page.regexp[host,
| 查找网页中的字符串,返回内容是被匹配内容的整行字符串,或者其他可选参数 |
| wmi.get[namespace,query] | 执行 WMI 查询返回第一个对象。返回整形、浮点、字符串或者文本内容 |
| wmi.getall[namespace,query] | 执行 WMI 查询并返回包含所有选定对象的 JSON 文档 |
| zabbix.stats[,,queue,,] | Number of items in the queue which are delayed in Zabbix server or proxy by “from” till “to” seconds, inclusive. |
| zabbix.stats[,] | Returns a JSON object containing Zabbix server or proxy internal metrics. |
4.2 触发器函数
| 功能(函数) | 含义 |
|---|---|
| last() | 最近值(最新值) |
| nodata() | 是否有数据 |
| diff() | 是否发生变化 |
| avg() | 平均值 |
| min() | 最小值 |
| max() | 最大值 |
5. 自定义监控-参数案例
- 目标:检查指定用户是否存在异地登录
- 命令的选择
# 1. w who 只能实时的显示
# 2。 last lastlog显示最近登录的用户和ip地址
5.1 客户端
- 使用命令提取ip
lastlog | grep root | awk '{print$3}'
可能以后查找的用户不是root,可以在定义键值时候指定参数
- 定义键值
# UserParameter=key,cmd
UserParameter=user.login.check[*],lastlog | grep "$1"| awk '{print $$3}'

# [*] 表示一个带参数的键值,但键值不知多少个
# $1表示第一个参数

# 自定义带参数键值时候,awk的$会失效,需写成 $$3
- 测试
root@node1:/root # zabbix_agent2 -t 'user.login.check[root]'
user.login.check[root]                        [s|192.168.100.1]
5.2 服务端
root@master:/root # zabbix_get -s 192.168.100.5 -p 10050 -k 'user.login.check[root]'
192.168.100.1
- 添加监控项

- 添加触发器

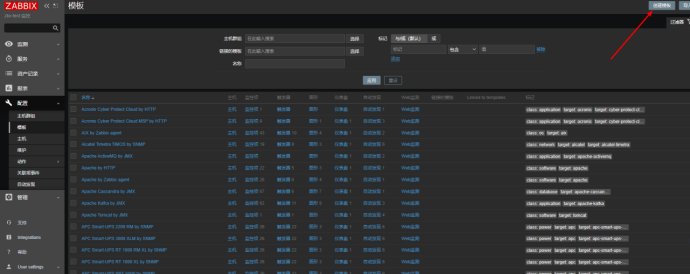
6. 创建自定义模板
- 通过自定义模板实现:监控项、触发器、图形的批量使用
- 步骤
- 创建模板
- 添加自定义监控项目
- 添加触发器
- 添加图形
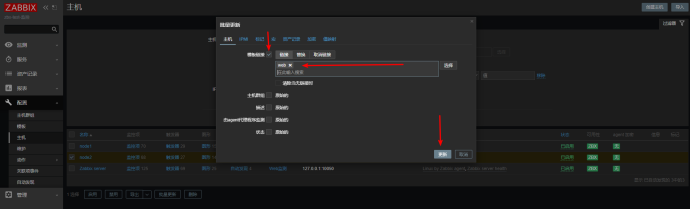
- 模板关联主机
6.1 创建模板

- 宏:是指Zabbix内模板里的变量,名称为: {$name}
- 添加完模板后,复制监控项

- 复制触发器
- 复制图形

- 关联模板到主机
如果模板中的监控项内定义的键值在所监控的主机没有的话,需要将配置文件一并发过去,重启客户端服务
scp /etc/zabbix/zabbix_agent2.d/*.conf node2:/etc/zabbix/zabbix_agent2.d/
systemctl restart zabbix-agent2


 2721
2721


 被折叠的 条评论
为什么被折叠?
被折叠的 条评论
为什么被折叠?
 到【灌水乐园】发言


