


业务背景
数据服务当前使用阿里云的日志服务进行访问日志的存储(SQL的打印,URL的请求),其可用性不是很友好,在面对生产环境出现的紧急问题时,问题不好排查;因此考虑将数据服务访问Phoenix的SQL日志记录下来,
在排查问题的时候比较有帮助。
使用步骤
在phonenix的4.1.4版本以后phoneix增加了SYSTEM.LOG的日志表,进行SQL的记录,其中不包含对系统表的SQL记录操作,具体如下所示,在客户端增加如下属性
1. 使用JDBC的方式添加如下两个参数
1.1 phoenix.log.level
参数说明:
此参数告诉Phoneix的客户端是否打开日志记录功能,如果打开的话,在通过phoenix的方式通过SQL的方式访问的时候顺便会把查询的SQL写入到SYSTEM.LOG表中;默认情况下次功能是关闭的
可选参数:
OFF : No logging
INFO:Enables query logging
DEBUG:More details on Query (Explain plan, HBase Scan Details etc)
TRACE:Logs query bind parameters as well.
1.2 phoenix.log.sample.rate
参数说明:
表示在开启Phoenix日志的时候,其中日志的采集频率是多少。
可选参数:
此值是介于(0,1】之间的一个小数,代表了百分比。
1.3 使用案例如下图所示
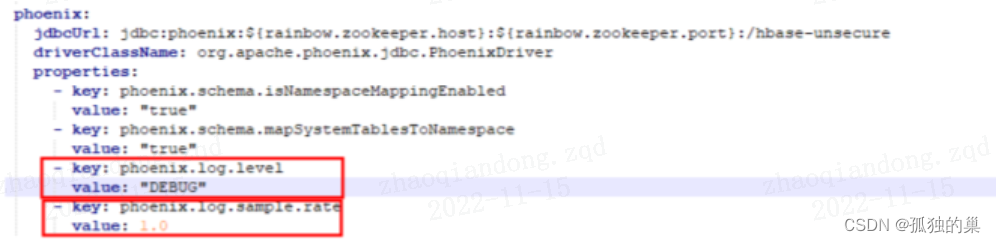
2. 使用phoenix的自带客户端的方式。(修改hbase-site.xml)文件,添加上述两个属性。具体如下所示
<property>
<name>phoenix.log.level</name>
<value>DEBUG</value>
</property>
<property>
<name>phoenix.log.sample.rate</name>
<value>1.0</value>
</property>
开启日志后可能存在的问题
1.日志量的暴涨
1.1 通过阿里云日志排查每天查询Phoenix的SQL语句大概有450万左右
2.对生产线性能影响
2.1 每天这么大的日志写入量会不会对phoneix的查询性能,HBASE写入性能造成影响
3.日志如何删除
每天450万的日志量,1个月下来差不多1.4亿记录,面对这么大的日志量,如何清除系统访问日志。
日志表涉及的关键JAVA类
查询SQL日志记录类【org.apache.phoenix.log.QueryLogger.java】
查询日志类型枚举类【org.apache.phoenix.log.LogLevel.java】
查询日志基础字段类【org.apache.phoenix.log.QueryLogInfo.java】
监控SQL日志字段信息类【org.apache.phoenix.log.MetricType.java】
探寻日志表内幕
带着以上3个问题,针对日志表进行源码探查
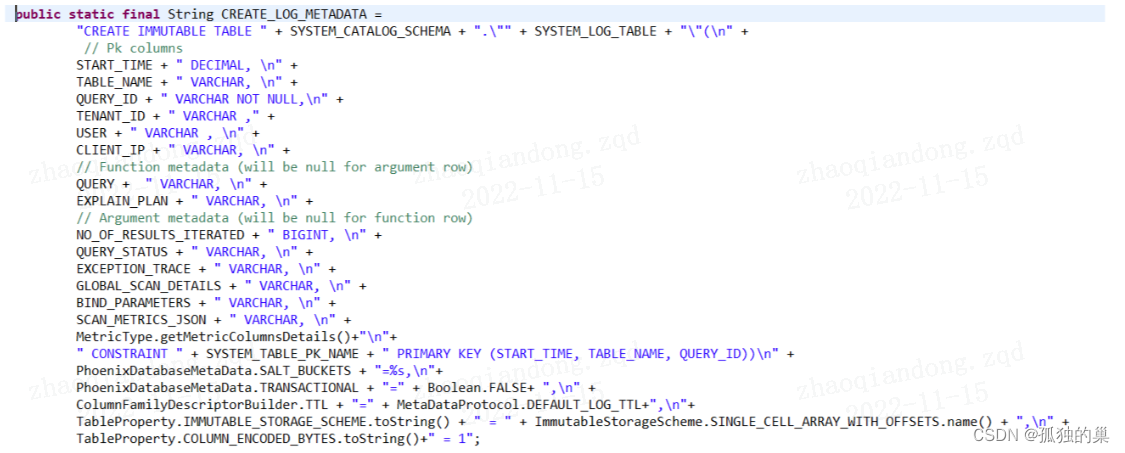
1. 日志表结构(phoenix源码类 org.apache.phoenix.query.QueryConstants.java)
2. phoenix日志表SYSTEM.LOG字段如下
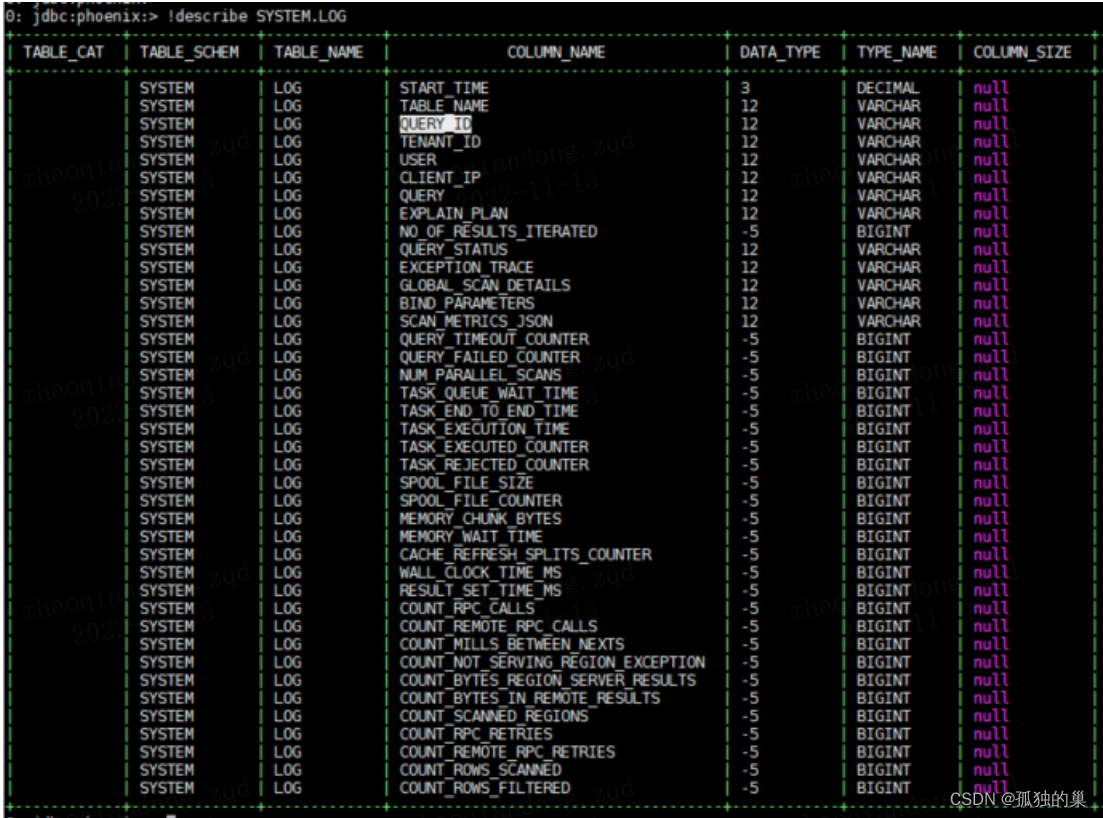
2. phoenix日志表SYSTEM.LOG字段说明如下
字段名称 日志级别 字段用途
START_TIME INFO
TABLE_NAME INFO
QUERY_ID INFO
TENANT_ID INFO
USER INFO
CLIENT_IP INFO
QUERY INFO
EXPLAIN_PLAN DEBUG
NO_OF_RESULTS_ITERATED
QUERY_STATUS INFO
EXCEPTION_TRACE TRACE
GLOBAL_SCAN_DETAILS DEBUG
BIND_PARAMETERS DEBUG
SCAN_METRICS_JSON TRACE
QUERY_TIMEOUT_COUNTER DEBUG Number of times query timed out
QUERY_FAILED_COUNTER DEBUG Number of times query failed
NUM_PARALLEL_SCANS DEBUG Number of scans that were executed in parallel
SCAN_BYTES OFF Number of bytes read by scans
SELECT_SQL_COUNTER OFF Counter for number of sql queries
TASK_QUEUE_WAIT_TIME DEBUG Time in milliseconds tasks had to wait in the queue of the thread pool executor
TASK_END_TO_END_TIME DEBUG Time in milliseconds spent by tasks from creation to completion
TASK_EXECUTION_TIME DEBUG Time in milliseconds tasks took to execute
TASK_EXECUTED_COUNTER DEBUG Counter for number of tasks submitted to the thread pool executor
TASK_REJECTED_COUNTER DEBUG Counter for number of tasks that were rejected by the thread pool executor
SPOOL_FILE_SIZE DEBUG Size of spool files created in bytes
SPOOL_FILE_COUNTER DEBUG Number of spool files created
MEMORY_CHUNK_BYTES DEBUG Number of bytes allocated by the memory manager
MEMORY_WAIT_TIME DEBUG Number of milliseconds threads needed to wait for memory to be allocated through memory manager
CACHE_REFRESH_SPLITS_COUNTER DEBUG Number of times cache was refreshed because of splits
WALL_CLOCK_TIME_MS INFO Wall clock time elapsed for the overall query execution
RESULT_SET_TIME_MS INFO Wall clock time elapsed for reading all records using resultSet.next()
COUNT_RPC_CALLS DEBUG Number of RPC calls
COUNT_REMOTE_RPC_CALLS DEBUG Number of remote RPC calls
COUNT_MILLS_BETWEEN_NEXTS DEBUG Sum of milliseconds between sequential next calls
COUNT_NOT_SERVING_REGION_EXCEPTION DEBUG Number of NotServingRegionException caught
COUNT_BYTES_REGION_SERVER_RESULTS DEBUG Number of bytes in Result objects from region servers
COUNT_BYTES_IN_REMOTE_RESULTS DEBUG Number of bytes in Result objects from remote region servers
COUNT_SCANNED_REGIONS DEBUG Number of regions scanned
COUNT_RPC_RETRIES DEBUG Number of RPC retries
COUNT_REMOTE_RPC_RETRIES DEBUG Number of remote RPC retries
COUNT_ROWS_SCANNED DEBUG Number of rows scanned
COUNT_ROWS_FILTERED DEBUG Number of rows filtered
3. 根据表的创建脚本可知日志数据的存贮周期为7天如下所示
ColumnFamilyDescriptorBuilder.TTL + "=" + MetaDataProtocol.DEFAULT_LOG_TTL+" 其中值为【7 * 24 * 60 * 60】
4. 根据创建脚本可知日志表的主键为
" CONSTRAINT " + SYSTEM_TABLE_PK_NAME + " PRIMARY KEY (START_TIME, TABLE_NAME, QUERY_ID))\n"


 被折叠的 条评论
为什么被折叠?
被折叠的 条评论
为什么被折叠?
 到【灌水乐园】发言


