


如上图
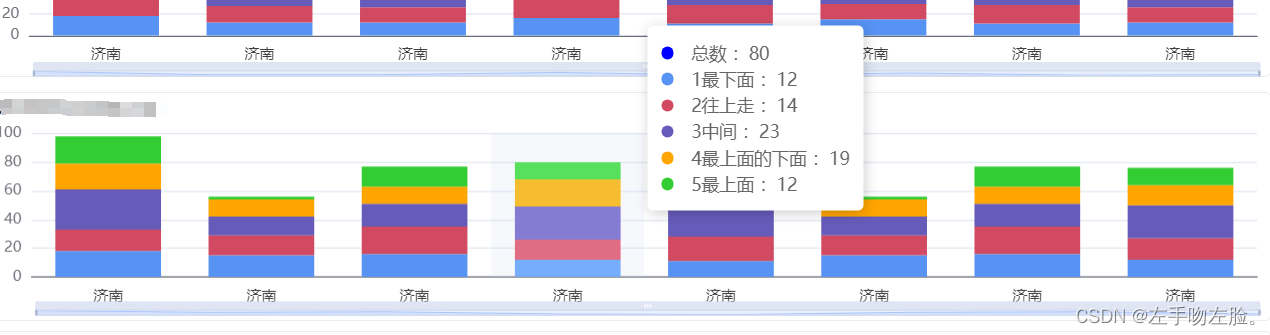
1、堆叠柱状图实际上就是将好几个柱子叠加起来成一根
<template>
  <div id="echarts12"></div>
</template>

<script setup>
import * as echarts from "echarts";
const emit = defineEmits();

const props = defineProps({
  echartList: {
    default: [{ cityName: "济南", parkArea: 18, parkArea1: 15, paraks: 28, asd: 18, asff: 19 },
    { cityName: "济南", parkArea: 15, parkArea1: 14, paraks: 13, asd: 12, asff: 2 },
    { cityName: "济南", parkArea: 16, parkArea1: 19, paraks: 16, asd: 12, asff: 14 },
    { cityName: "济南", parkArea: 12, parkArea1: 14, paraks: 23, asd: 19, asff: 12 },
    { cityName: "济南", parkArea: 11, parkArea1: 17, paraks: 20, asd: 12, asff: 18 },
    { cityName: "济南", parkArea: 15, parkArea1: 14, paraks: 13, asd: 12, asff: 2 },
    { cityName: "济南", parkArea: 16, parkArea1: 19, paraks: 16, asd: 12, asff: 14 },
    { cityName: "济南", parkArea: 12, parkArea1: 15, paraks: 23, asd: 14, asff: 12 },],
  },
  dolDate: {
    defalut: false
  }
});
const initChart = () => {
  let xdata = [];
  let ydata1 = [];
  let ydata2 = [];
  let ydata3 = [];
  let ydata4 = [];
  let ydata5 = [];//对比日期
  let xdataid = [];
  props.echartList.forEach((item) => {
    xdata.push(item.cityName);
    // xdataid.push(item.cityId);
    ydata1.push(item.parkArea);
    ydata2.push(item.parkArea1);
    ydata3.push(item.paraks);
    ydata4.push(item.asd);
    ydata5.push(item.asff);
    // ydata2.push(item.water);
  });
  const machart = echarts.init(document.getElementById("echarts12"));
  var defaultShowNum = 10; // 默认显示的数据条数

  var start = 0;
  var end = Math.min(defaultShowNum, xdata.length) / xdata.length * 100;
  var option = {

    tooltip: {
      trigger: 'axis',
      axisPointer: {
        // 坐标轴指示器,坐标轴触发有效
        type: 'shadow' // 默认为直线,可选为:'line' | 'shadow'
      },
      //这里是tooltip也就是提示框
      formatter: (params) => {
        let res = ''
        let sum = 0
        for (let i = 0; i < params.length; i++) {
          if (params[i].value != 0) {
            sum += params[i].data
            res += `<span style="background: ${params[i].color}; height:10px; width: 10px; border-radius: 50%;display: inline-block;margin-right:10px;"></span> ${params[i].seriesName} :${params[i].data}<br/>`
          }
        }
        return (
          `<span style="background: blue; height:10px; width: 10px; border-radius: 50%;display: inline-block;margin-right:10px;"></span> 总数 :${sum}<br/>` +
          res
        )
      }
    },


    dataZoom: [
      {
        type: 'slider', // 缩放条类型为滑动条
        show: true, // 显示缩放条
        start: start, // 根据数据计算的开始位置
        end: end, // 根据数据计算的结束位置
        bottom: '5%', // 距离底部的距离
        height: 5, // 设置高度
      },
      {
        type: 'inside', // 内置缩放条
        start: start,
        end: end,
      },
    ],
    calculable: true,

    color: ["#579AFF", "#B1B1F0", "#F7BEBE", '#BDF6E6'],
    grid: {
      top: "10%",
      bottom: "20%",
      left: "4%",
      right: "1%",
      // containLabel: true,
    },
    xAxis: [
      {
        type: "category",
        data: xdata,
        axisTick: {
          show: false, // 不显示刻度
        },
        axisLabel: {
          margin: 10,
          color: "#3D3D3D",
          textStyle: {
            fontSize: 12,
          },

        },
      },
    ],
    yAxis: [
      {
        type: "value",

      },
    ],

    series: [
      {
        name: '1最下面',
        type: 'bar',
        stack: 'total',
        data: ydata1,
        itemStyle: {
          color: '#5793f3' // 设置柱状图颜色
        }
      },
      {
        name: '2往上走',
        type: 'bar',
        stack: 'total',
        data: ydata2,
        itemStyle: {
          color: '#d14a61' // 设置柱状图颜色
        }
      },
      {
        name: '3中间',
        type: 'bar',
        stack: 'total',
        data: ydata3,
        itemStyle: {
          color: '#675bba' // 设置柱状图颜色
        }
      },
      {
        name: '4最上面的下面',
        type: 'bar',
        stack: 'total',
        data: ydata4,
        itemStyle: {
          color: '#ffa500' // 设置柱状图颜色
        }
      },
      {
        name: '5最上面',
        type: 'bar',
        stack: 'total',
        data: ydata5,
        itemStyle: {
          color: '#32cd32' // 设置柱状图颜色
        }
      }

    ],
  };

  machart.setOption(option);
  setTimeout(() => {
    window.addEventListener("resize", resizeFn);
  }, 100);
  const resizeFn = () => {
    return machart.resize();
  };
  machart.on("click", (params) => {
    if (params.componentType === "series") {
      const dataIndex = params.dataIndex;
      const yValue = xdata[dataIndex]; // 获取对应柱子的y值
      // const cidtyid = xdataid[dataIndex]; // 获取对应柱子的y值
      emit("changedi", yValue);

      // 在这里你可以对获取到的y值进行其他操作,比如弹窗显示等
    }
  });
};
setTimeout(() => {
  initChart();
}, 800);
defineExpose({
  initChart,
});
onBeforeUnmount(() => {
  // 离开页面必须进行移除,否则会造成内存泄漏,导致卡顿
  window.removeEventListener("resize", initChart);
});
watch(
  () => props.echartList,
  (newVal, oldVal) => {
    if (newVal !== oldVal) {
      initChart();
    }
  }
);
</script>

<style scoped>
#echarts12 {
  width: 100%;
  height: 90%;
  /* height:    calc(30vh- 10px); */
}
</style>


 2161
2161


 被折叠的 条评论
为什么被折叠?
被折叠的 条评论
为什么被折叠?
 到【灌水乐园】发言


