


检查是否加上英文逗号
最近在绘图时,碰到了这样一个问题,用 matplotlib 为曲线添加legend的时候发现只显示一个透明方框,添加注记的文字并没有预期展示。
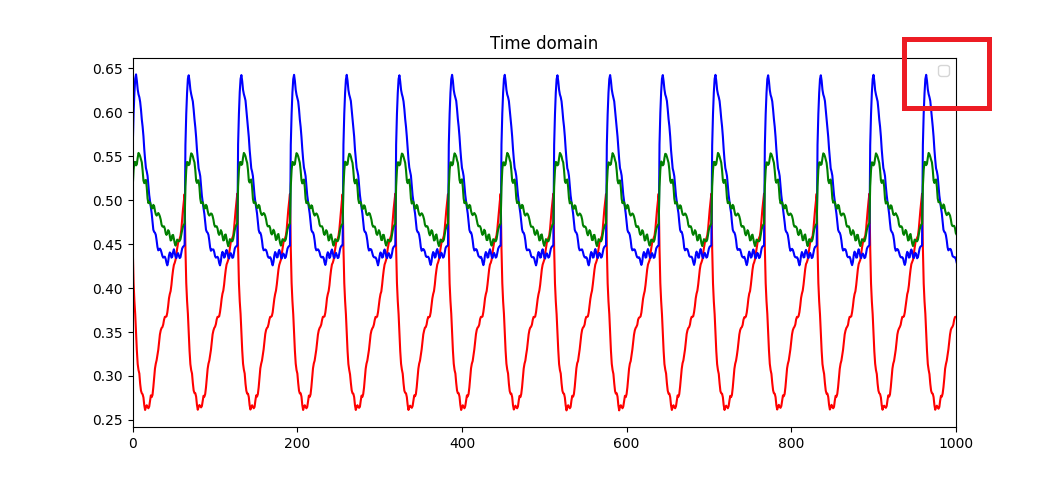
经调查,出问题的代码部分,是在这:
# time domain
L1 = plt.plot(tt,data_shaped[0],'r')
L2 = plt.plot(tt,data_shaped[1],'b')
L3 = plt.plot(tt,data_shaped[2],'g')

# legend
plt.legend([L1, L2, L3],['Tx-Rx1', 'Tx-Rx2', 'Tx-Rx3'],loc = 'upper right')
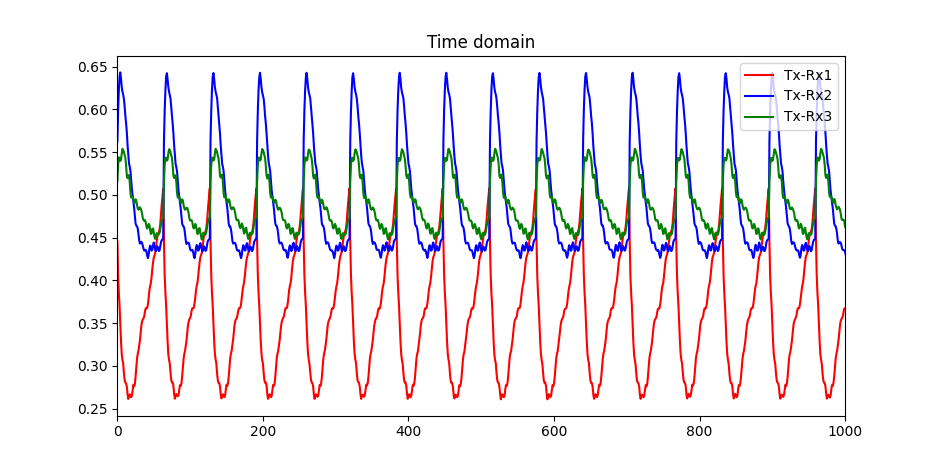
解决方法是:在L1,L2,L3这三条曲线对象后加上英文逗号
即修改为
# time domain
L1, = plt.plot(tt,data_shaped[0],'r')
L2, = plt.plot(tt,data_shaped[1],'b')
L3, = plt.plot(tt,data_shaped[2],'g')
透明框就消失并正常显示注记文字了
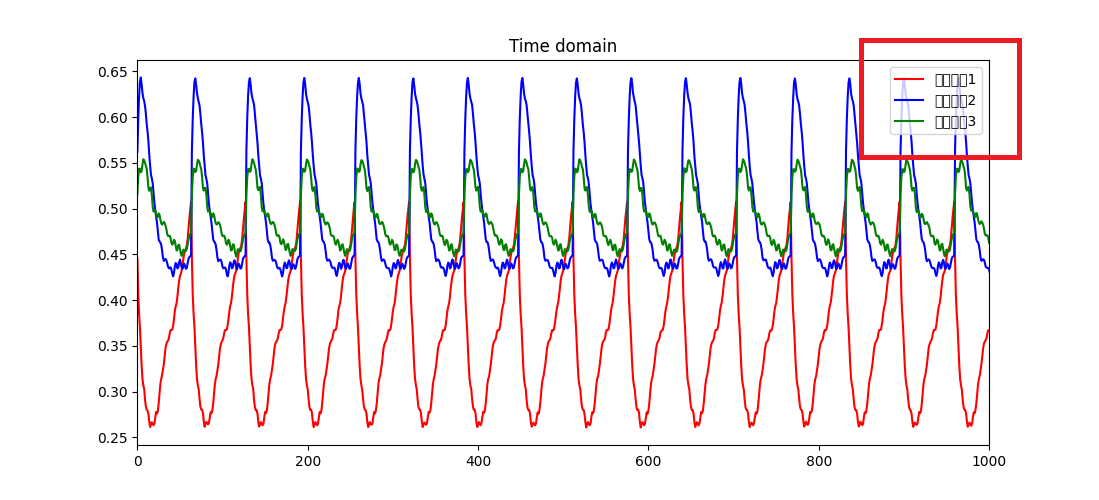
注意设置中文环境
再补充一个之前就遇到过的问题,即 直接添加中文注记也是不行的,中文将只会以粗线框的形式显示。
# time domain
L1, = plt.plot(tt,data_shaped[0],'r')
L2, = plt.plot(tt,data_shaped[1],'b')
L3, = plt.plot(tt,data_shaped[2],'g')

# legend
plt.legend([L1, L2, L3],['接收天线1', '接收天线2', '接受天线3'],loc = 'upper right')
这是因为matplotlib默认不支持中文,需在开头设置中文环境。即在开头新加入
import pylab as mpl

# 设置中文显示字体,因为matplotlib默认不支持中文
mpl.rcParams['font.sans-serif'] = ['FangSong']  # 指定默认字体为仿宋
之后也就能正常显示了: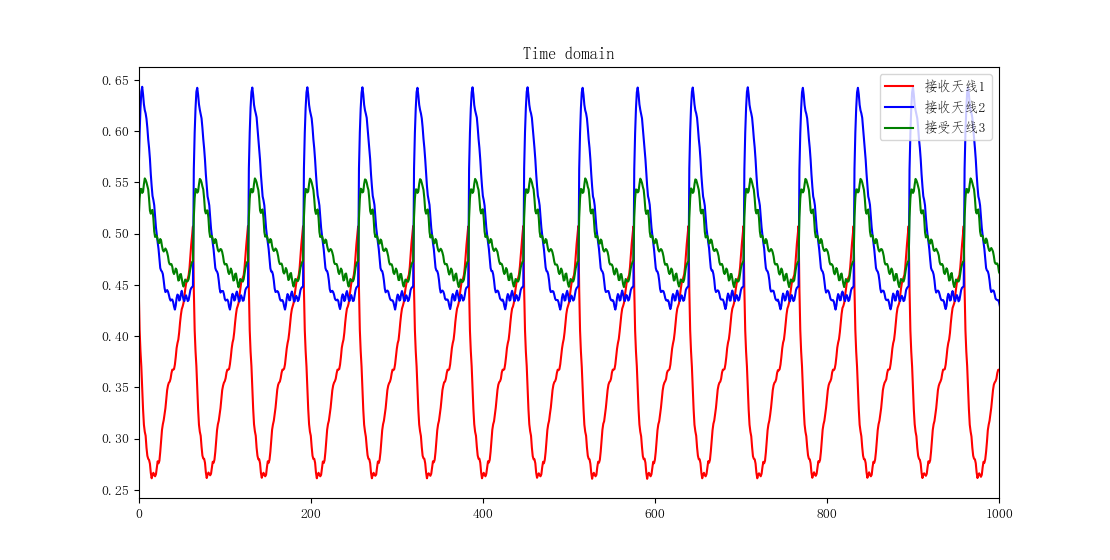


 被折叠的 条评论
为什么被折叠?
被折叠的 条评论
为什么被折叠?
 到【灌水乐园】发言


