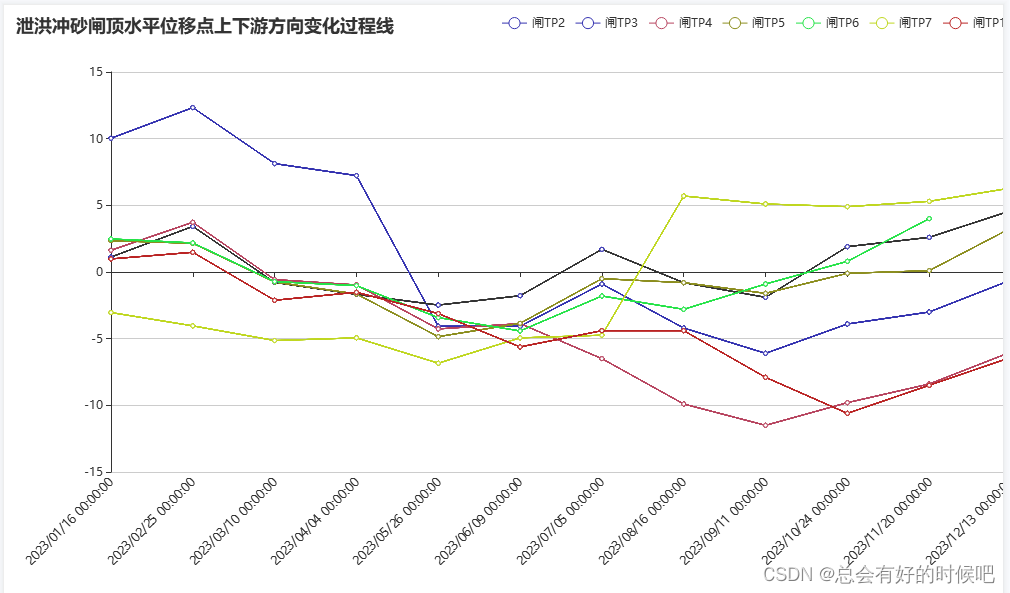
JAVA集成Echars生成多条折线图
最终效果图展示:
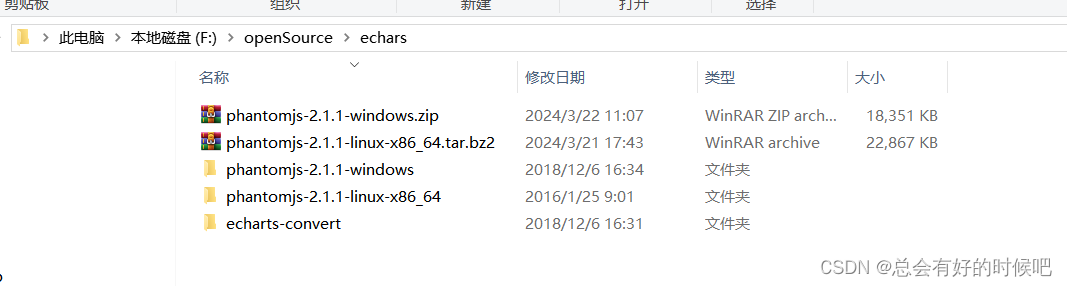
1.下载phantomjs和echarts-convert工具,这两个是必备的(phantomjs官网有不同版本,根据操作系统下载不同版本即可)
网盘地址:https://pan.baidu.com/s/1mkto1Q-zGswpzl1lwN-qUA
提取码:8888
2.在pom中集成依赖
        <!--导出echarts图片-->
        <dependency>
            <groupId>org.freemarker</groupId>
            <artifactId>freemarker</artifactId>
            <version>2.3.28</version>
        </dependency>
        <dependency>
            <groupId>com.github.abel533</groupId>
            <artifactId>ECharts</artifactId>
            <version>2.2.6</version>
        </dependency>
        <dependency>
            <groupId>com.google.code.gson</groupId>
            <artifactId>gson</artifactId>
            <version>2.8.9</version>
        </dependency>
        <dependency>
            <groupId>org.apache.httpcomponents</groupId>
            <artifactId>httpclient</artifactId>
            <version>4.5.13</version>
        </dependency>
3.java代码部分
1.将下载的js文件的完整路径定义成常量,方便使用(注意不同环境,存放的位置可能不同,需要进行修改)
    //windows
    private static final String JSpath = "F:/openSource/echars/echarts-convert/echarts-convert1.js";

    //linux
    //private static final String JSpath = "/usr/local/echars/echarts-convert/echarts-convert1.js";
2.根据Echars生成图片的方法(这里的循环是为了将线条数据进行组装)
public String createPngByEchars(List<Map<String, Object>> lines, Map<String, Object> property) throws Exception       {
        MetricsMonitor metricsMonitor = new MetricsMonitor();
        List<List<PmsMetricsMonitorIndexVO>> list = new ArrayList<>();

        for (Map<String, Object> line : lines) {
            List<Map<String, Object>> valueData = (List<Map<String, Object>>) line.get("valueData");
            List<PmsMetricsMonitorIndexVO> monitorIndexVOList = new ArrayList<>();
            for (Map<String, Object> map : valueData) {
                PmsMetricsMonitorIndexVO vo = new PmsMetricsMonitorIndexVO();
                vo.setCurrentTimeStr(map.get("watchTime").toString());
                if (map.get("value") == null) {
                    vo.setTechDeliDura(null);
                } else {
                    vo.setTechDeliDura(new BigDecimal(map.get("value").toString()));
                }
                monitorIndexVOList.add(vo);
            }
            list.add(monitorIndexVOList);
        }

        metricsMonitor.setMetricsMonitorList(list);
        Option option = getTechDeliDuraOption(metricsMonitor, lines, property);

        return generateEChart(new Gson().toJson(option),property);
    }

参数说明:lines中有线条的一些规格如:线条颜色,线条粗细等等,每条线的点位数据则在其中使用data进行数组存放
         property中存放着图表的名称,Y轴的最大最小值等属性信息
3.配置图表的属性和样式
public static Option getTechDeliDuraOption(MetricsMonitor
metricsMonitor, List<Map<String, Object>> lines, Map<String, Object> property) {
List<List<PmsMetricsMonitorIndexVO>> metricsMonitorList = metricsMonitor.getMetricsMonitorList();
Option optionTechDeliDura = new Option();
Title title = new Title();
title.setText(property.get("name").toString());
title.setTextAlign(X.left);
optionTechDeliDura.setTitle(title);
optionTechDeliDura.tooltip().trigger(Trigger.axis);
Legend legend = new Legend();
List<Object> legendData = new ArrayList<>();
for (Map<String, Object> line : lines) {
legendData.add(line.get("point").toString());
}
legend.setX("right");
legend.setY("top");
legend.setOrient(Orient.horizontal);
optionTechDeliDura.setLegend(legend);
CategoryAxis xAxis = new CategoryAxis();
xAxis.setType(AxisType.category);
xAxis.setBoundaryGap(false);
List<Object> xAxisData = new ArrayList<>();
for (PmsMetricsMonitorIndexVO vo : metricsMonitorList.get(0)) {
xAxisData.add(vo.getCurrentTimeStr());
}
xAxis.setData(xAxisData);
AxisLabel axisLabel = new AxisLabel();
axisLabel.setRotate(45);
xAxis.setAxisLabel(axisLabel);
List<Axis> axisListX = new ArrayList<>();
axisListX.add(xAxis);
optionTechDeliDura.setxAxis(axisListX);
AxisLabel axisLabel2 = new AxisLabel();
axisLabel2.setFormatter("{value} " + lines.get(0).get("unit"));
ValueAxis yAxis = new ValueAxis();
yAxis.setType(AxisType.value);
yAxis.setMax(new BigDecimal(property.get("valueMax").toString()).intValue());
yAxis.setMin(new BigDecimal(property.get("valueMin").toString()).intValue());
List<Axis> axisListY = new ArrayList<>();
axisListY.add(yAxis);
optionTechDeliDura.setyAxis(axisListY);
Grid grid = new Grid();
grid.setWidth(900);
grid.setHeight(400);
optionTechDeliDura.setGrid(grid);
Label lineLabel = new Label();
lineLabel.setShow(false);
lineLabel.setPosition(Position.top);
for (int i = 0; i < metricsMonitorList.size(); i++) {
Line lineTechDeliDura = new Line();
List<Object> techDeliDuraData = new ArrayList<>();
for (PmsMetricsMonitorIndexVO vo : metricsMonitorList.get(i)) {
if (vo.getTechDeliDura() != null) {
lineTechDeliDura.setType(SeriesType.line);
lineTechDeliDura.setName(lines.get(i).get("point").toString());
lineTechDeliDura.itemStyle().normal().color(lines.get(i).get("color").toString());
lineTechDeliDura.itemStyle().normal().lineStyle()
.width(Integer.parseInt(lines.get(i).get("blod").toString()));
techDeliDuraData.add(vo.getTechDeliDura());
} else {
techDeliDuraData.add("-");
}
lineTechDeliDura.setData(techDeliDuraData);
lineTechDeliDura.itemStyle().normal().label(lineLabel);
lineTechDeliDura.setShowAllSymbol(true);
optionTechDeliDura.series(lineTechDeliDura);
}
}
return optionTechDeliDura;
}
4.创建生成图片需要的json文件
public static String writeFile(String options) {
String dataPath = "C:/Users/asus/Desktop/test/" + UUID.randomUUID().toString().substring(0, 8) + ".json";
try {
File writename = new File(dataPath);
if (!writename.exists()) {
File dir = new File(writename.getParent());
dir.mkdirs();
writename.createNewFile();
}
BufferedWriter out = new BufferedWriter(new FileWriter(writename));
out.write(options);
out.flush();
out.close();
} catch (IOException e) {
e.printStackTrace();
}
return dataPath;
}
5.生成图片保存到本地
public static String generateEChart(String options, Map<String, Object> property) {
SimpleDateFormat sdf = new SimpleDateFormat("yyyy-MM-dd-HHmmss");
String nowDate = sdf.format(new Date());
String dataPath = writeFile(options);
String fileName = String.format("%s+" + property.get("name").toString() + "+.png", nowDate);
String path = "C:/Users/asus/Desktop/test/" + fileName;
try {
File file = new File(path);
if (!file.exists()) {
File dir = new File(file.getParent());
dir.mkdirs();
file.createNewFile();
}
String cmd = "F:\\openSource\\echars\\phantomjs-2.1.1-windows\\bin\\phantomjs " + JSpath + " -infile " + dataPath + " -outfile " + path;
Process process = Runtime.getRuntime().exec(cmd);
BufferedReader input = new BufferedReader(new InputStreamReader(process.getInputStream()));
String line = "";
while ((line = input.readLine()) != null) {
System.out.println("line++++++++++++++++++++" + line);
}
input.close();
} catch (IOException e) {
e.printStackTrace();
} finally {
return path;
}
}
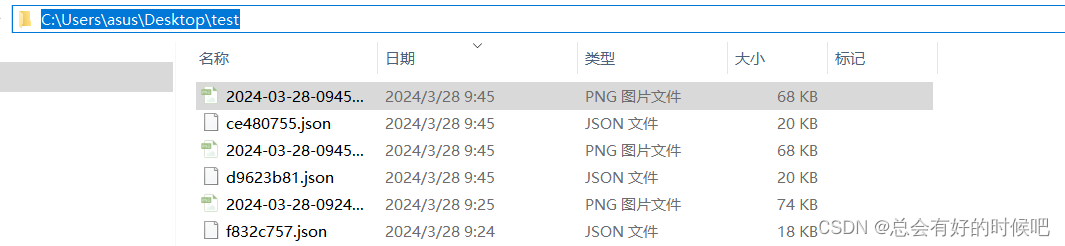
6.最后就会生成两个文件,一个json文件和绘制出来的图片文件


 本文详细介绍了如何在Java项目中通过Echarts生成多条折线图,并结合PhantomJS工具进行图片转换,包括依赖管理、代码实现和图片生成过程。


 1461
1461


 被折叠的 条评论
为什么被折叠?
被折叠的 条评论
为什么被折叠?
 到【灌水乐园】发言


