不废话 取之即用
<template>
  <div>
    <div>
      <div id="barMain"
        style="width: 1300px; height:700px"></div>
    </div>
  </div>
</template>

<script>
import "echarts-gl";
import * as echarts from "echarts";

export default {
  name: "Bar3DSimpleGraph",
  mounted() {
    this.drawLine();
  },
  methods: {
    //开始画图了
    drawLine() {
      console.log(this);
      // 基于准备好的dom,初始化echarts实例
      let myChart = echarts.init(document.getElementById("barMain"));

      var valMin = 29;
      var valMax = 30;

      let option = {
        visualMap: {
          show: false,
          min: valMin,
          max: valMax,
          inRange: {
            color: [
              "#313695",
              "#4575b4",
              "#74add1",
              "#abd9e9",
              "#e0f3f8",
              "#ffffbf",
              "#fee090",
              "#fdae61",
              "#f46d43",
              "#d73014",
              "#a50026",
            ],
            colorAlpha: [1],
          },
        },
        xAxis3D: {
          type: "value",
        },
        yAxis3D: {
          type: "value",
        },
        zAxis3D: {
          type: "value",
        },
        grid3D: {
          viewControl: {
            // autoRotate: true
          },
          light: {
            main: {
              shadow: true,
              quality: "ultra",
              intensity: 1.5,
            },
          },
        },
        tooltip: {},
        legend: {
          data: ["一档", "二档", "三档", "四档", "五档"],
        },
        series: [
          {
            type: "bar3D",
            name: "一档",

            data: [
              [0, 0, 1, 1],
              [1, 0, 1, 59],
              [2, 0, 1, 1],
              [3, 0, 1, 1],
              [4, 0, 1, 1],
              [0, 1, 1, 1],
              [1, 1, 1, 1],
              [2, 1, 1, 1],
              [3, 1, 1, 1],
              [4, 1, 1, 1],
              [0, 2, 1, 1],
              [1, 2, 1, 1],
              [2, 2, 1, 1],
              [3, 2, 1, 1],
              [4, 2, 1, 1],
              [0, 3, 1, 1],
              [1, 3, 1, 1],
              [2, 3, 1, 1],
              [3, 3, 1, 1],
              [4, 3, 1, 1],
            ],

            stack: "stack",
            shading: "lambert",
            emphasis: {
              label: {
                show: false,
              },
            },
            itemStyle: {
              opacity: 0.4,
            },
          },
          {
            type: "bar3D",
            name: "二档",
            data: [
              [0, 0, 1, 1],
              [1, 0, 1, 1],
              [2, 0, 1, 1],
              [3, 0, 1, 1],
              [4, 0, 1, 1],
              [0, 1, 1, 1],
              [1, 1, 1, 1],
              [2, 1, 1, 1],
              [3, 1, 1, 1],
              [4, 1, 1, 1],
              [0, 2, 1, 1],
              [1, 2, 1, 1],
              [2, 2, 1, 1],
              [3, 2, 1, 1],
              [4, 2, 1, 1],
              [0, 3, 1, 1],
              [1, 3, 1, 1],
              [2, 3, 1, 1],
              [3, 3, 1, 1],
              [4, 3, 1, 1],
            ],
            stack: "stack",
            shading: "lambert",
            emphasis: {
              label: {
                show: false,
              },
            },
            itemStyle: {
              opacity: 0.4,
            },
          },
          {
            type: "bar3D",
            name: "三档",
            data: [
              [0, 0, 1, 28],
              [1, 0, 1, 28],
              [2, 0, 1, 28],
              [3, 0, 1, 28],
              [4, 0, 1, 28],
              [0, 1, 1, 28],
              [1, 1, 1, 28],
              [2, 1, 1, 28],
              [3, 1, 1, 28],
              [4, 1, 1, 28],
              [0, 2, 1, 28],
              [1, 2, 1, 28],
              [2, 2, 1, 28],
              [3, 2, 1, 28],
              [4, 2, 1, 28],
              [0, 3, 1, 28],
              [1, 3, 1, 28],
              [2, 3, 1, 28],
              [3, 3, 1, 28],
              [4, 3, 1, 28],
            ],
            stack: "stack",
            shading: "lambert",
            emphasis: {
              label: {
                show: false,
              },
            },
            itemStyle: {
              opacity: 0.4,
            },
          },
          {
            type: "bar3D",
            name: "四档",
            data: [
              [0, 0, 1, 16],
              [1, 0, 1, 16],
              [2, 0, 1, 16],
              [3, 0, 1, 16],
              [4, 0, 1, 16],
              [0, 1, 1, 16],
              [1, 1, 1, 16],
              [2, 1, 1, 16],
              [3, 1, 1, 16],
              [4, 1, 1, 16],
              [0, 2, 1, 16],
              [1, 2, 1, 16],
              [2, 2, 1, 16],
              [3, 2, 1, 16],
              [4, 2, 1, 16],
              [0, 3, 1, 16],
              [1, 3, 1, 16],
              [2, 3, 1, 16],
              [3, 3, 1, 16],
              [4, 3, 1, 36],
            ],
            stack: "stack",
            shading: "lambert",
            emphasis: {
              label: {
                show: false,
              },
            },
            itemStyle: {
              opacity: 0.4,
            },
          },
          {
            maxHeight: 2,
            type: "bar3D",
            name: "五档",
            data: [
              [0, 0, 1],
              [1, 0, 1],
              [2, 0, 1],
              [3, 0, 1],
              [4, 0, 1],
              [0, 1, 1],
              [1, 1, 1],
              [2, 1, 1],
              [3, 1, 1],
              [4, 1, 1],
              [0, 2, 1],
              [1, 2, 1],
              [2, 2, 1],
              [3, 2, 1],
              [4, 2, 1],
              [0, 3, 1],
              [1, 3, 1],
              [2, 3, 1],
              [3, 3, 1],
              [4, 3, 1],
            ],
            stack: "stack",
            shading: "lambert",
            emphasis: {
              label: {
                show: false,
              },
            },
            itemStyle: {
              opacity: 0.4,
            },
          },
        ],
      };
      // 使用刚指定的配置项和数据显示图表。
      myChart.setOption(option);
    },
  },
};
</script>

<style scoped>
</style>


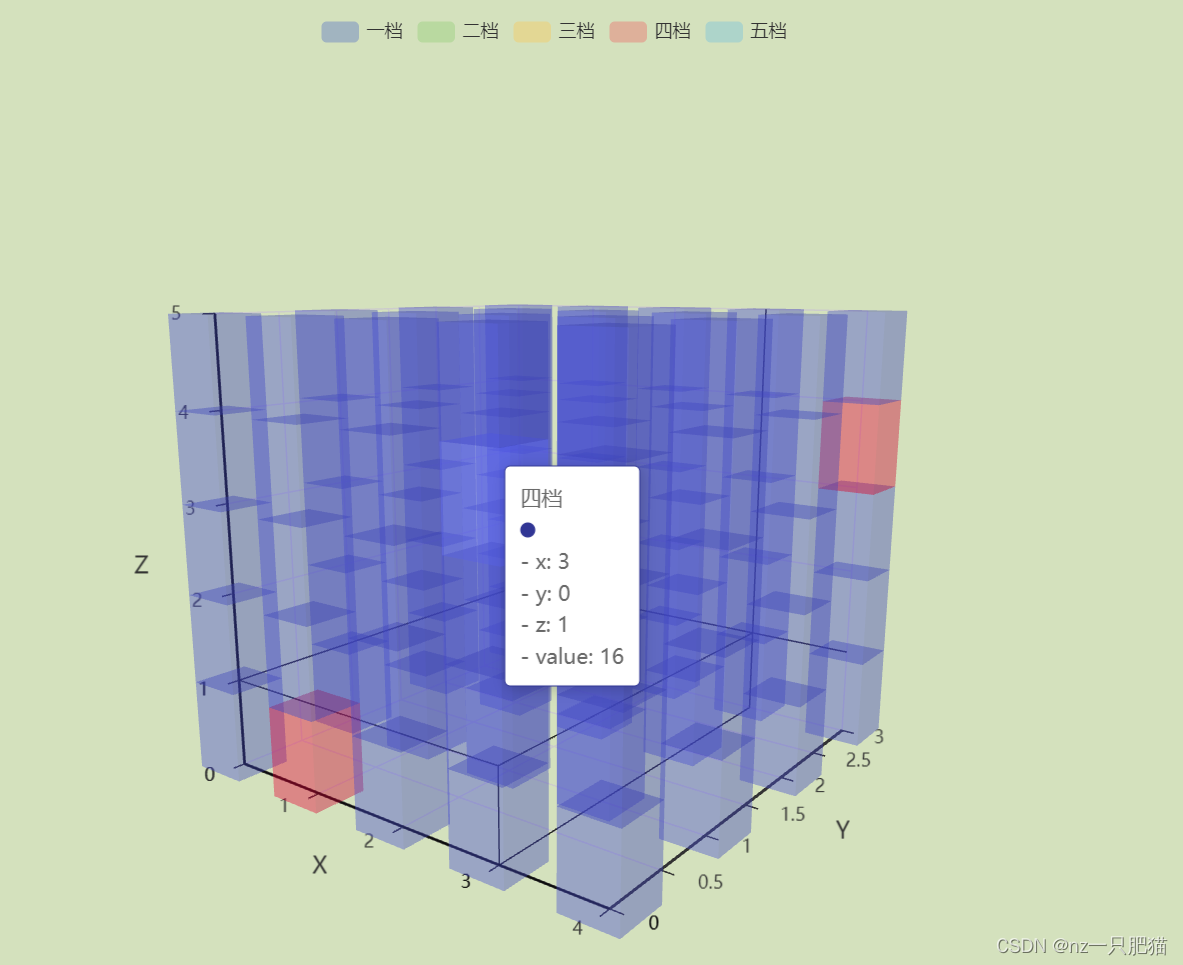
 文章详细描述了如何使用ECharts库在HTML页面上创建一个3D柱状图,展示了五个等级的数据分布,以及如何设置视觉映射和样式选项。


 2453
2453

 被折叠的 条评论
为什么被折叠?
被折叠的 条评论
为什么被折叠?
 到【灌水乐园】发言


