


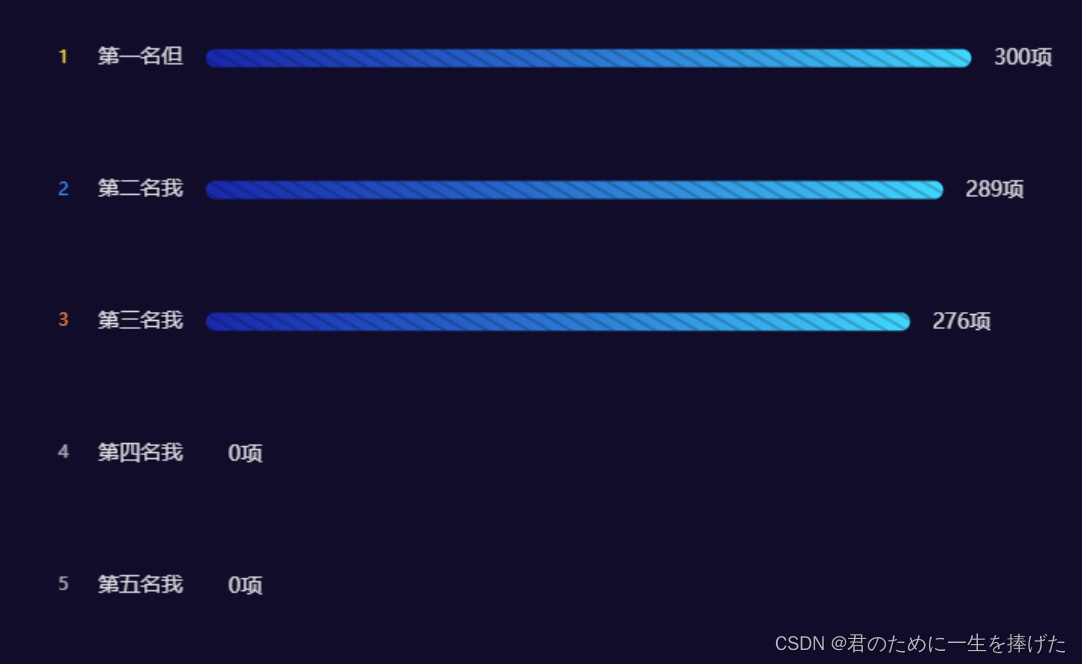
采用Echarts实现top排序条形图的实现方式的代码如下:
var yData = ['第一名但', '第二名我', '第三名我', '第四名我', '第五名我'];
var seriesData = [300, 289, 276, 0, 0];

option = {
  tooltip: {},
      legend: {
        show: false,
      },
      grid: {
        top: '-3%',
        left: '-8%',
        bottom: '3%',
        containLabel: true
      },
      xAxis: {
        type: "value",
        splitLine: {
          show: false,
        },
        axisLabel: {
          show: false,
        },
        axisTick: {
          show: false,
        },
        axisLine: {
          show: false,
        },
      },
      yAxis: [
        {
          type: "category",
          inverse: true,
          axisLine: {
            show: false,
          },
          axisTick: {
            show: false,
          },
          axisPointer: {
            label: {
              show: false,
              margin: 30,
            },
          },
          data: yData,
          axisLabel: {
            margin: 110,
            fontSize: 14,
            align: "left",
            color: "rgba(255,255,255,0.85)",
            // 配置序号背景
            rich: {
              a1: {
                color: "#FFD743",
                width: 30,
                height: 30,
                align: "center",
              },
              a2: {
                color: "#4690FF",
                width: 30,
                height: 30,
                align: "center",
              },
              a3: {
                color: "#FF8A45",
                width: 30,
                height: 30,
                align: "center",
              },
              b: {
                color: "rgba(255,255,255,0.65)",
                width: 30,
                height: 30,
                align: "center",
              },
            },
            formatter: function (params, index) {
              var leftIndex = index + 1;
              if (leftIndex < 4) {
                return ["{a" + leftIndex + "|" + leftIndex + "}" + "  "+params].join(
                  "\n"
                );
              } else {
                return ["{b|" + leftIndex + "}" + "  " +params].join("\n");
              }
            },
          },
        },
      ],
      series: [
        {
          zlevel: 2,
          type: "bar",
          barWidth: 12,
          data: seriesData,
          itemStyle: {
            color: {
              type: "linear",
              x: 0,
              y: 0,
              x2: 1,
              y2: 0,
              colorStops: [
                {
                  offset: 0,
                  color: "rgba(27,46,204,0.80)", // 0% 处的颜色
                },
                {
                  offset: 1,
                  color: " #41D7FF", // 100% 处的颜色
                },
              ],
            },
            barBorderRadius: [8, 8, 8, 8],
          },
          label: {
            show: true,
            position: "right",
            color: "rgba(255,255,255,0.85)",
            fontSize: 14,
            offset: [10, 1],
            formatter:function(params){
              return params.value + '项'
            }
          },
        },
      ],
};
效果图如下:


 被折叠的 条评论
为什么被折叠?
被折叠的 条评论
为什么被折叠?
 到【灌水乐园】发言


