


| 节点IP | 节点功能 | 节点名称 |
|---|---|---|
| 192.168.199.222 | Elasticsearch+Kibana(主) | elk-1 |
| 192.168.199.10 | Elasticsearch+Logstash(数据) | elk-2 |
| 192.168.199.20 | Elasticsearch(数据) | elk-3 |
环境准备
1、修改节点名称
elk-1:
# hostnamectl set-hostname elk-1
# bash
elk-2:
# hostnamectl set-hostname elk-2
# bash
elk-3:
# hostnamectl set-hostname elk-3
# bash
2、配置hosts文件
# vim /etc/hosts
127.0.0.1   localhost localhost.localdomain localhost4 localhost4.localdomain4
::1         localhost localhost.localdomain localhost6 localhost6.localdomain6
192.168.199.222 elk-1
192.168.199.10 elk-2
192.168.199.20 elk-3
3、安装jdk
# yum install -y java-1.8.0-openjdk java-1.8.0-openjdk-devel
# java -version
openjdk version "1.8.0_242"
OpenJDK Runtime Environment (build 1.8.0_242-b08)
OpenJDK 64-Bit Server VM (build 25.242-b08, mixed mode)

部署Elasticserach
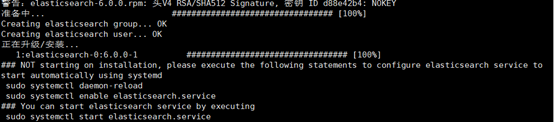
1、安装
# wget https://mirrors.tuna.tsinghua.edu.cn/elasticstack/6.x/yum/6.0.0/elasticsearch-6.0.0.rpm
# rpm -ivh elasticsearch-6.0.0.rpm
2、配置
elk-1:
[root@elk-1 ~]# vim /etc/elasticsearch/elasticsearch.yml
................
# ------------------Cluster --------------------
# Use a descriptive name for your cluster:
cluster.name: ELK
# ------------------------Node -----------------
# Use a descriptive name for the node:
node.name: elk-1
node.master: true
node.data: false
# ----------------- Paths ----------------
# Path to directory where to store the data (separate multiple locations by comma):
path.data: /var/lib/elasticsearch
# Path to log files:
path.logs: /var/log/elasticsearch
# --------------- Network ------------------
# Set the bind address to a specific IP (IPv4 or IPv6):
network.host: 192.168.199.222
# Set a custom port for HTTP:
http.port: 9200
# For more information, consult the network module documentation.
# --------------------Discovery ----------------
# Pass an initial list of hosts to perform discovery when new node is started:
# The default list of hosts is ["127.0.0.1", "[::1]"]
#discovery.zen.ping.unicast.hosts: ["host1", "host2"]
discovery.zen.ping.unicast.hosts: ["elk-1","elk-2","elk-3"]
elk-2:
[root@elk-2 ~]# vim /etc/elasticsearch/elasticsearch.yml
................
# ------------------Cluster --------------------
# Use a descriptive name for your cluster:
cluster.name: ELK
# ------------------------Node -----------------
# Use a descriptive name for the node:
node.name: elk-2
node.master: false
node.data: 	true
# ----------------- Paths ----------------
# Path to directory where to store the data (separate multiple locations by comma):
path.data: /var/lib/elasticsearch
# Path to log files:
path.logs: /var/log/elasticsearch
# --------------- Network ------------------
# Set the bind address to a specific IP (IPv4 or IPv6):
network.host: 192.168.199.10
# Set a custom port for HTTP:
http.port: 9200
# For more information, consult the network module documentation.
# --------------------Discovery ----------------
# Pass an initial list of hosts to perform discovery when new node is started:
# The default list of hosts is ["127.0.0.1", "[::1]"]
#discovery.zen.ping.unicast.hosts: ["host1", "host2"]
discovery.zen.ping.unicast.hosts: ["elk-1","elk-2","elk-3"]
elk-3:
[root@elk-3 ~]# vim /etc/elasticsearch/elasticsearch.yml
................
# ------------------Cluster --------------------
# Use a descriptive name for your cluster:
cluster.name: ELK
# ------------------------Node -----------------
# Use a descriptive name for the node:
node.name: elk-3
node.master: false
node.data: true
# ----------------- Paths ----------------
# Path to directory where to store the data (separate multiple locations by comma):
path.data: /var/lib/elasticsearch
# Path to log files:
path.logs: /var/log/elasticsearch
# --------------- Network ------------------
# Set the bind address to a specific IP (IPv4 or IPv6):
network.host: 192.168.199.20
# Set a custom port for HTTP:
http.port: 9200
# For more information, consult the network module documentation.
# --------------------Discovery ----------------
# Pass an initial list of hosts to perform discovery when new node is started:
# The default list of hosts is ["127.0.0.1", "[::1]"]
#discovery.zen.ping.unicast.hosts: ["host1", "host2"]
discovery.zen.ping.unicast.hosts: ["elk-1","elk-2","elk-3"]
3、启动
# systemctl start elasticsearch

# ps -ef |grep elasticsearch
# netstat -lntp
// 测试是否成功启动以及查看端口

4、检查集群状态
[root@elk-1 ~]# curl '192.168.40.11:9200/_cluster/health?pretty'

部署Kibana (elk-1)
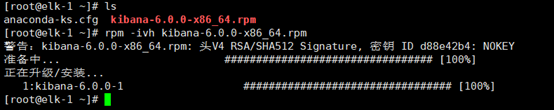
1、安装
[root@elk-1 ~]# wget https://mirrors.tuna.tsinghua.edu.cn/elasticstack/6.x/yum/6.0.0/kibana-6.0.0-x86_64.rpm
[root@elk-1 ~]# rpm -ivh kibana-6.0.0-x86_64.rpm
2、配置
[root@elk-1 ~]# vim /etc/kibana/kibana.yml
server.port: 5601
server.host: "192.168.199.222"
elasticsearch.url: "http://192.168199.222:9200"
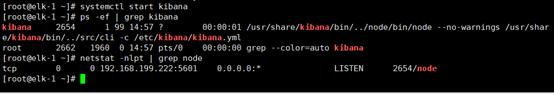
3、启动
[root@elk-1 ~]# systemctl start kibana

[root@elk-1 ~]# ps -ef |grep kibana
[root@elk-1 ~]# netstat -lntp |grep node
// 测试是否成功启动以及查看端口
4、网页访问

部署Logstash (elk-2)
1、安装
[root@elk-2 ~]# wget https://mirrors.tuna.tsinghua.edu.cn/elasticstack/6.x/yum/6.0.0/logstash-6.0.0.rpm
[root@elk-2 ~]# rpm -ivh logstash-6.0.0.0.rpm
2、配置
[root@elk-2 ~]# vim /etc/logstash/logstash.yml
http.host: "192.168.199.10"
[root@elk-2 ~]# vim /etc/logstash/conf.d/syslog.conf
input {
    syslog {
        type => "systemlog"
        port => 10514
    }
}
output {
    stdout {
      codec => rubydebug
    }
}
[root@elk-2 ~]# ln -s /usr/share/logstash/bin/logstash /usr/bin
// 创建软连接,方便使用logstash命令
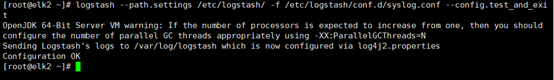
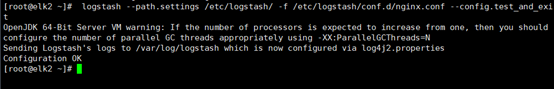
[root@elk-2 ~]# logstash --path.settings /etc/logstash/ -f /etc/logstash/conf.d/syslog.conf --config.test_and_exit
// 检查配置文件
[root@elk-2 ~]# vim /etc/rsyslog.conf
#### RULES ####
*.* @@192.168.199.10:10514

[root@elk-2 ~]# systemctl restart rsyslog
[root@elk-2 ~]# chown -R logstash /var/lib/logstash/
3、启动
[root@elk-2 ~]# logstash --path.settings /etc/logstash/ -f /etc/logstash/conf.d/syslog.conf
新建一个窗口
# ssh root@192.168.199.10
[root@elk-2 ~]#ps -ef |grep logstash
[root@elk-2 ~]# netstat -lntp
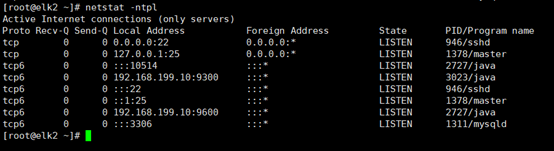
4、测试
另一个窗口登录,产生日志
# ssh root@192.168.199.10
按Ctel+D退出

查看ekl-2是否产生日志
5、将日志输出给ES
[root@elk-2 ~]# vi /etc/logstash/conf.d/syslog.conf
input {
    syslog {
        type => "systemlog"
        port => 10514
    }
}
output {
elasticsearch {
      hosts => ["192.168.199.222:9200"]
      index => "system-syslog-%{+YYYY.MM}"
   }
}
重启
[root@elk-2 ~]# systemctl restart logstash
[root@elk-2 ~]# netstat -ntpl
6、Kibana上查看日志
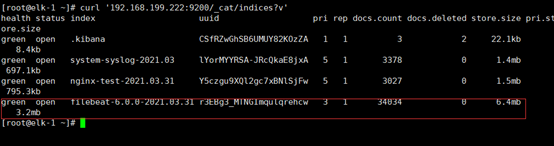
[root@elk-1 ~]# curl '192.168.40.11:9200/_cat/indices?v'
[root@elk-1 ~]# curl -XGET/DELETE '192.168.199.222:9200/system-log-2021.03?pretty'

7、网页上查看

部署Nginx (elk-2)
1、安装
[root@elk-2 ~]#wget http://nginx.org/packages/centos/7/x86_64/RPMS/nginx-1.16.1-1.el7.ngx.x86_64.rpm
[root@elk-2 ~]# rpm -ivh nginx-1.16.1-1.el7.ngx.x86_64.rpm
2、编辑 /etc/logstash/conf.d/nginx.conf
[root@elk-2 ~]# vim /etc/logstash/conf.d/nginx.conf
input {
  file {
    path => "/tmp/elk_access.log"
    start_position => "beginning"
    type => "nginx"
  }
}
filter {
    grok {
        match => { "message" => "%{IPORHOST:http_host} %{IPORHOST:clientip} - %{USERNAME:remote_user} \[%{HTTPDATE:timestamp}\] \"(?:%{WORD:http_verb} %{NOTSPACE:http_request}(?: HTTP/%{NUMBER:http_version})?|%{DATA:raw_http_request})\" %{NUMBER:response} (?:%{NUMBER:bytes_read}|-) %{QS:referrer} %{QS:agent} %{QS:xforwardedfor} %{NUMBER:request_time:float}"}
    }
    geoip {
        source => "clientip"
    }
}
output {
    stdout { codec => rubydebug }
    elasticsearch {
        hosts => ["192.168.199.222:9200"]
	index => "nginx-test-%{+YYYY.MM.dd}"
  }
}
3、检查
[root@elk-2 ~]# logstash --path.settings /etc/logstash/ -f /etc/logstash/conf.d/nginx.conf --config.test_and_exit
4、编辑 /etc/nginx/conf.d/elk.conf
[root@elk-2 ~]# vim /etc/nginx/conf.d/elk.conf
 server {
            listen 80;
            server_name elk.com;

            location / {
                proxy_pass      http://192.168.199.222:5601;
                proxy_set_header Host   $host;
                proxy_set_header X-Real-IP      $remote_addr;
                proxy_set_header X-Forwarded-For $proxy_add_x_forwarded_for;
            }
            access_log  /tmp/elk_access.log main2;
        }
5、编辑 /etc/nginx/nginx.conf
[root@elk-2 ~]#vim /etc/nginx/nginx.conf
log_format main2 '$http_host $remote_addr - $remote_user [$time_local] "$request" '
                      '$status $body_bytes_sent "$http_referer" '
                      '"$http_user_agent" "$upstream_addr" $request_time';
//在accesslog上方添加
6、检查并启动
[root@elk-2 ~]# nginx -t
nginx: the configuration file /etc/nginx/nginx.conf syntax is ok
nginx: configuration file /etc/nginx/nginx.conf test is successful
[root@elk-2 ~]# systemctl start nginx
[root@elk-2 ~]# systemctl restart logstash
7、浏览器访问

部署Beats (elk-3)
1、安装
[root@elk-3 ~]# wget https://artifacts.elastic.co/downloads/beats/filebeat/filebeat-6.0.0-x86_64.rpm
[root@elk-3 ~]#  rpm -ivh  filebeat-6.0.0-x86_64.rpm
2、编辑配置
[root@elk-3 ~]#  vim /etc/filebeat/filebeat.yml
filebeat.prospectors:
  #enabled: false //注释掉该参数
  paths:
    - /var/log/elasticsearch/ELK.log
output.elasticsearch:
  hosts: ["192.168.199.222:9200"]
3、检查
[root@elk-1 ~]# curl '192.168.199.222:9200/_cat/indices?v'
4、网页访问


 4516
4516


 被折叠的 条评论
为什么被折叠?
被折叠的 条评论
为什么被折叠?
 到【灌水乐园】发言


