


1.安装
npm install echarts --save
2.引入
全局引入(main.js)
import echarts from 'echarts'
Vue.prototype.$echarts=echarts
//如果报错可以使用
import *as echarts from 'echarts'
局部引用(页面script)
import echarts from 'echarts'
3. 创建容器(直接在template里面写上 div容器)
<div id="myChart"></div>
4.配置表格数据(data中)
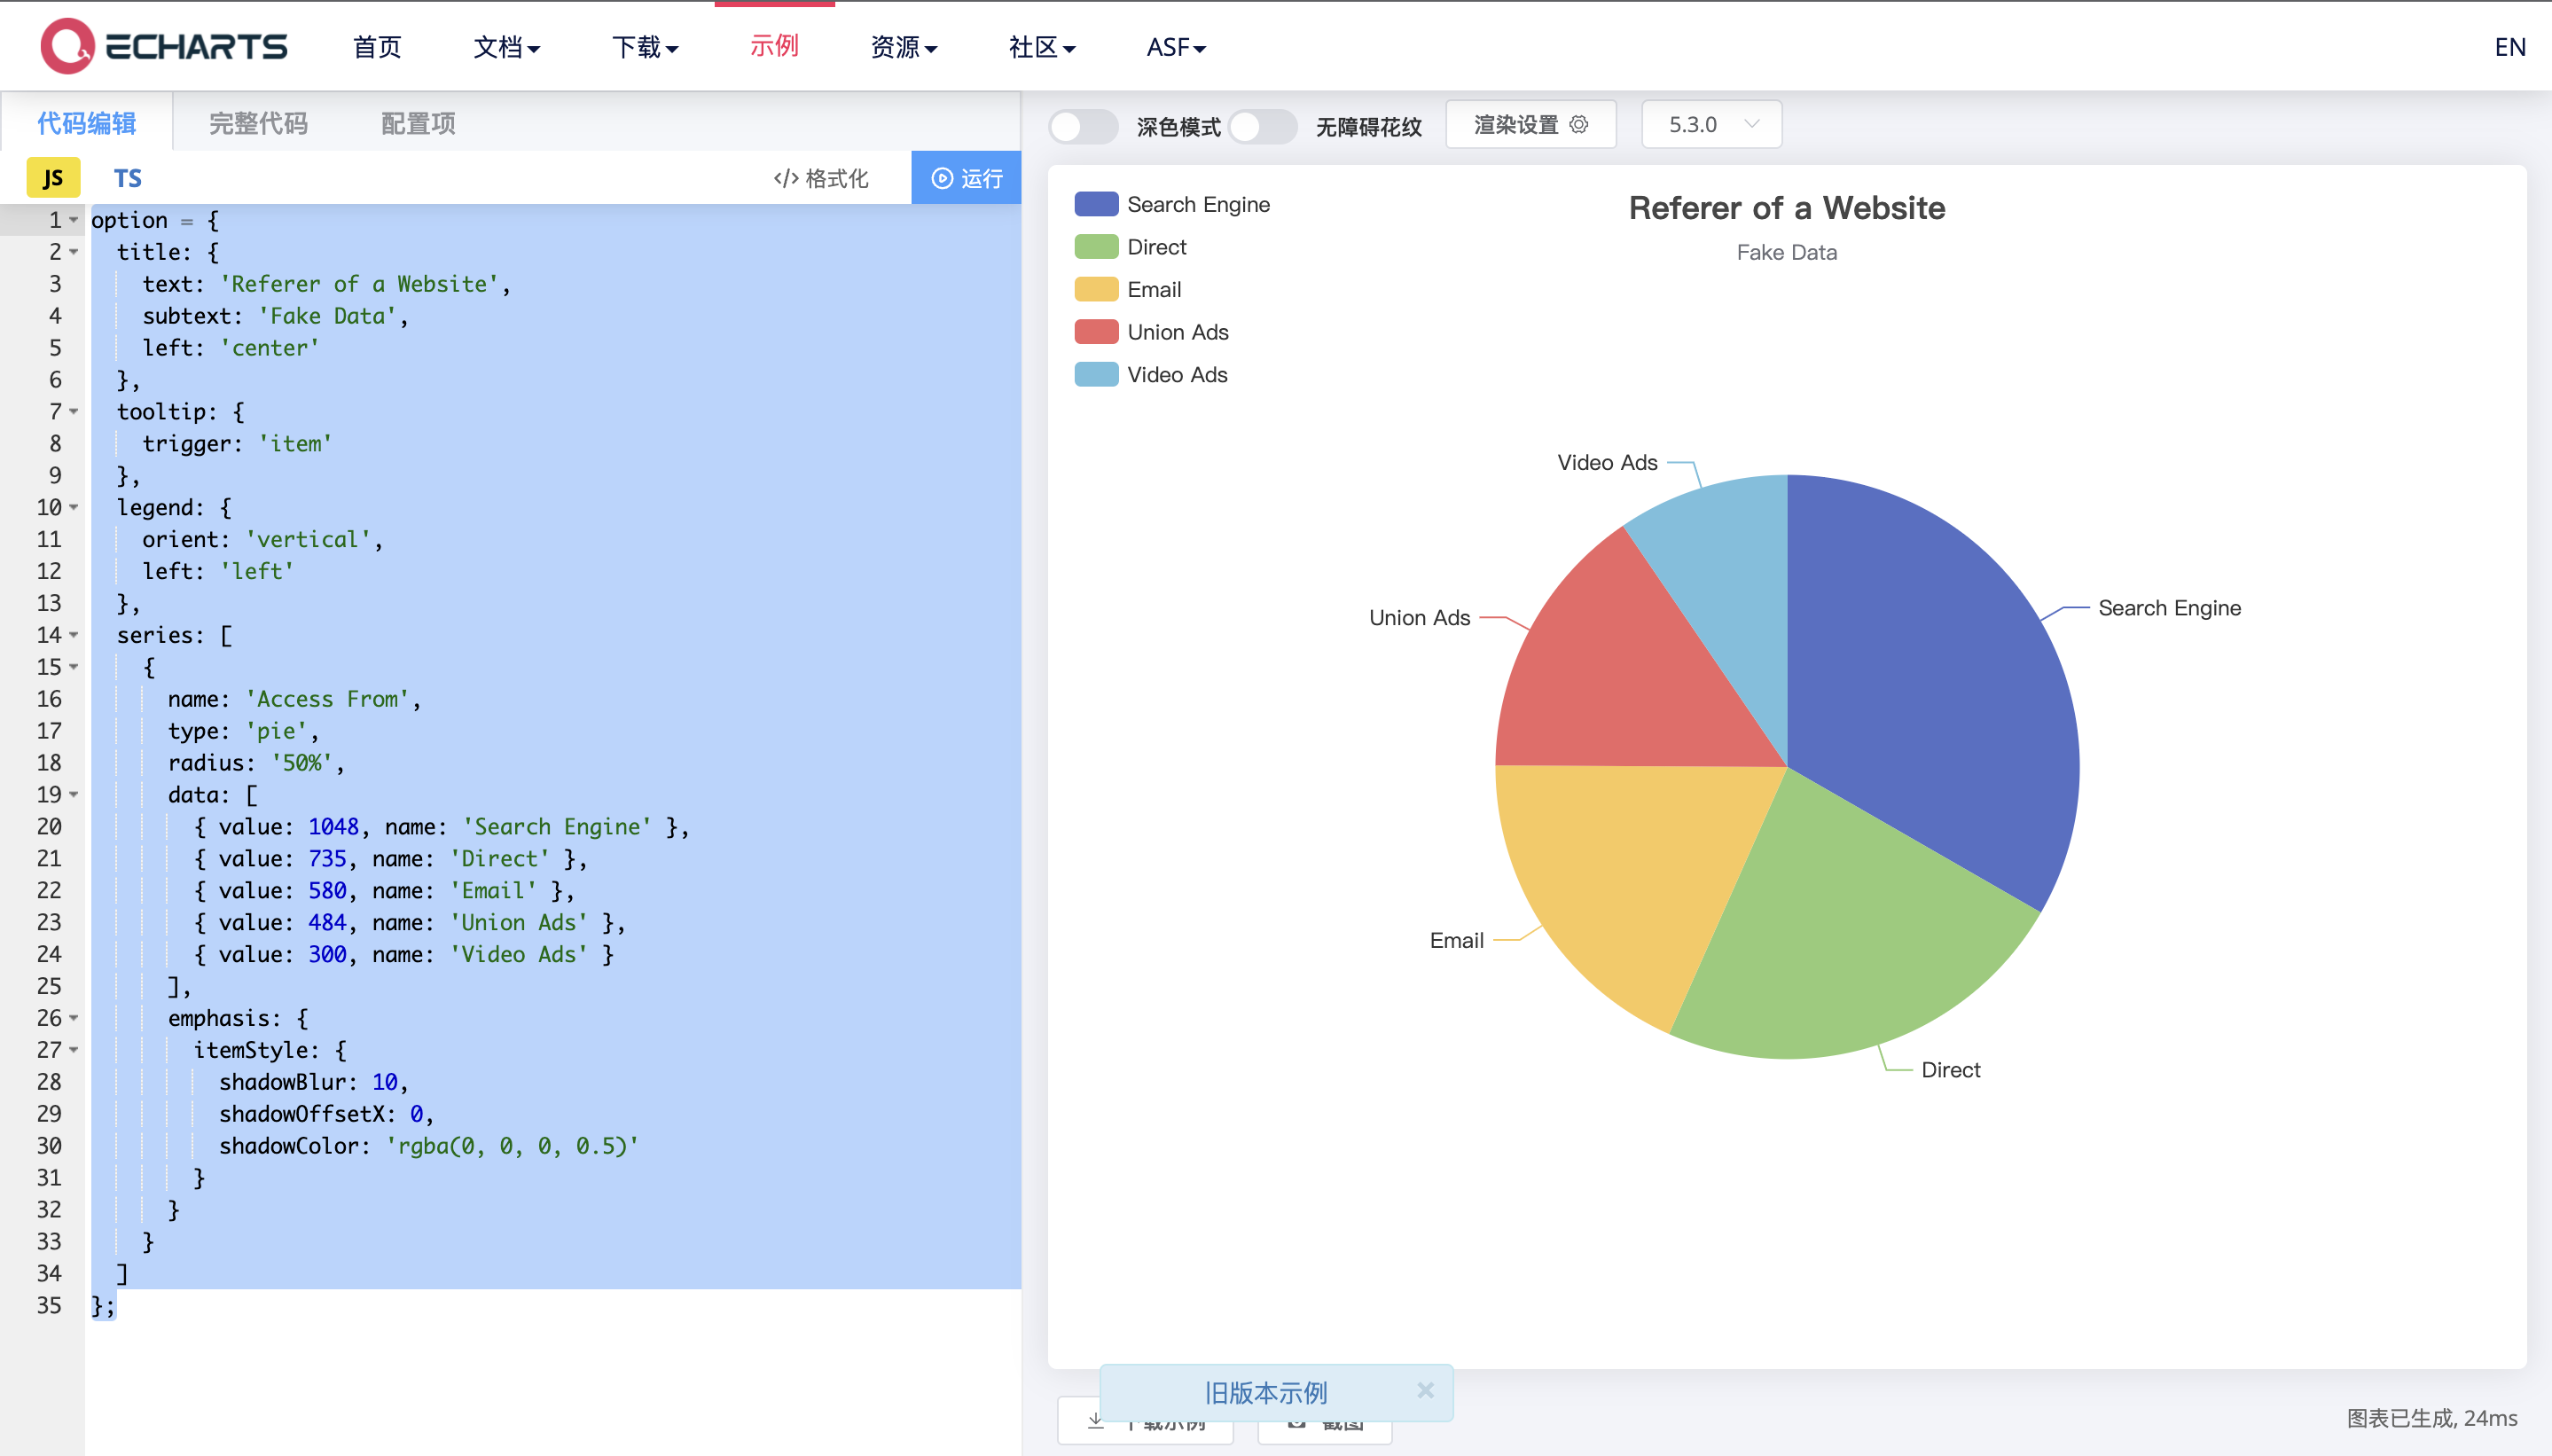
option = {
  title: {
    text: 'Referer of a Website',
    subtext: 'Fake Data',
    left: 'center'
  },
  tooltip: {
    trigger: 'item'
  },
  legend: {
    orient: 'vertical',
    left: 'left'
  },
  series: [
    {
      name: 'Access From',
      type: 'pie',
      radius: '50%',
      data: [
        { value: 1048, name: 'Search Engine' },
        { value: 735, name: 'Direct' },
        { value: 580, name: 'Email' },
        { value: 484, name: 'Union Ads' },
        { value: 300, name: 'Video Ads' }
      ],
      emphasis: {
        itemStyle: {
          shadowBlur: 10,
          shadowOffsetX: 0,
          shadowColor: 'rgba(0, 0, 0, 0.5)'
        }
      }
    }
  ]
};
在官网复制修改数据即可
5.绘制图表(methods)
rawLine(){
      let myChart = this.$echarts.init(document.getElementById("myChart"));
      myChart.setOption(this.option);
}
6.展示图表
需要讲“绘制图表代码的函数,挂载到mounted”
  mounted() {
    this.drawLine();
  },


 1077
1077


 被折叠的 条评论
为什么被折叠?
被折叠的 条评论
为什么被折叠?
 到【灌水乐园】发言


