


第一步:

第二步;
完整代码:
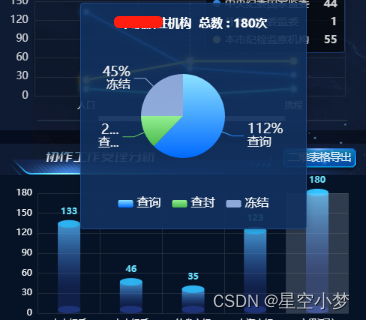
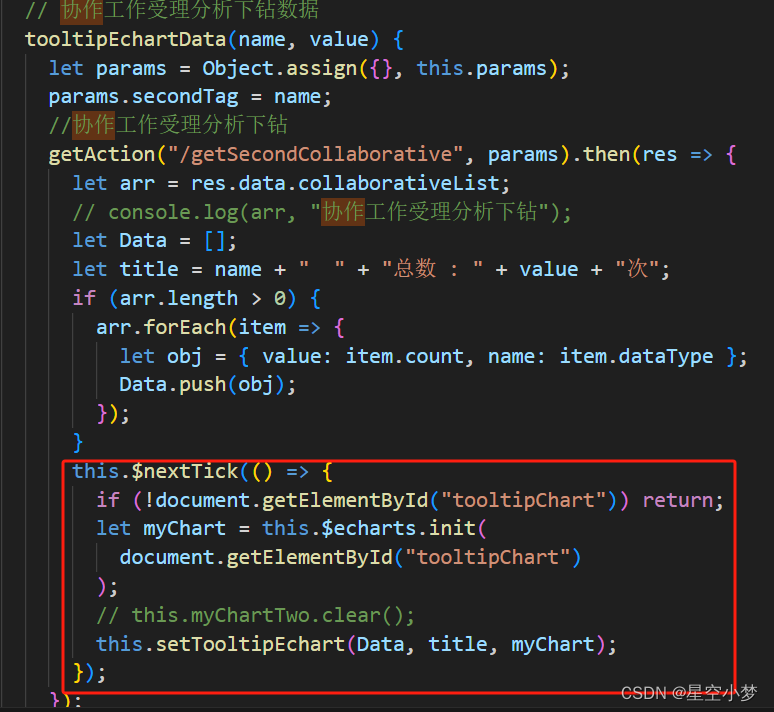
//协作工作受理分析圆柱形
    workLineChart(xData, yData) {
      let that = this;
      let option = {
        backgroundColor: "#061326",
        grid: {
          top: "10%",
          bottom: "5%",
          left: "5%",
          right: "5%",
          containLabel: true
        },
        tooltip: {
          trigger: "axis",
          axisPointer: {
            type: "shadow" // 默认为直线,可选为:'line' | 'shadow'
          },
          triggerOn: "click",
          // triggerOn: 'mousemove|click',
          formatter: (params, ticket, callback) => {
            let htmlStr = `<div id="tooltipChart" ref='tooltipChart' style='width:280px;height:280px;'></div>`;
            callback(that.tooltipEchartData(params[0].name, params[0].value));
            return htmlStr;
          },
          extraCssText: "z-index:99999",
          // backgroundColor: "rgba(0,0,0,0.9)",
          backgroundColor: "rgba(17,49,94,0.9)",
          borderWidth: 1,
          borderColor: "rgba(42, 92, 176, .6)",
          // textStyle: {
          //   color: "rgba(255,255,255,1)",
          // }
          transitionDuration: 0 // 让toolltip紧跟鼠标
          // position: function(point, params, dom, rect, size) {
          //   // 鼠标坐标和提示框位置的参考坐标系是:以外层div的左上角那一点为原点,x轴向右,y轴向下
          //   // 提示框位置
          //   var x = 0; // x坐标位置
          //   var y = 0; // y坐标位置
          //   // 当前鼠标位置
          //   var pointX = point[0];
          //   var pointY = point[1];
          //   // 外层div大小
          //   // var viewWidth = size.viewSize[0];
          //   // var viewHeight = size.viewSize[1];
          //   // 提示框大小
          //   var boxWidth = size.contentSize[0];
          //   var boxHeight = size.contentSize[1];
          //   // boxWidth > pointX 说明鼠标左边放不下提示框
          //   if (boxWidth > pointX) {
          //     x = 50;
          //   } else {
          //     // 左边放的下
          //     x = pointX - boxWidth;
          //   }
          //   // boxHeight > pointY 说明鼠标上边放不下提示框
          //   if (boxHeight > pointY) {
          //     y = -300;
          //   } else {
          //     // 上边放得下
          //     y = pointY - boxHeight;
          //   }
          //   return [x, y];
          // }
        },

        animation: false,
        xAxis: [
          {
            type: "category",
            data: xData,
            axisTick: {
              show: false,
              alignWithLabel: true
            },
            axisLine: {
              show: false,
              lineStyle: {
                color: "#82b0ec"
              }
            },
            splitLine: {
              show: true,
              lineStyle: { color: "#222D3E", width: 1, type: "solid" }
            },
            axisLabel: {
              interval: 0,
              formatter: function(params) {
                let newParamsName = "";
                const paramsNameNumber = params.length; // 文字总长度
                const provideNumber = 4; //一行显示几个字
                const rowNumber = Math.ceil(paramsNameNumber / provideNumber);
                if (paramsNameNumber > provideNumber) {
                  for (let p = 0; p < rowNumber; p++) {
                    const start = p * provideNumber;
                    const end = start + provideNumber;
                    const tempStr =
                      p === rowNumber - 1
                        ? params.substring(start, paramsNameNumber)
                        : params.substring(start, end) + "\n";
                    newParamsName += tempStr;
                  }
                } else {
                  newParamsName = params;
                }
                return newParamsName;
              },
              textStyle: {
                color: "#fff"
              }
            }
          }
        ],
        yAxis: [
          {
            show: true,
            type: "value",
            axisLabel: {
              textStyle: {
                color: "#fff"
              }
            },
            splitLine: {
              show: true,
              lineStyle: { color: "#222D3E", width: 1, type: "solid" }
            },
            axisLine: {
              show: false
            },
            textStyle: {
              color: "#00FFEF"
            }
          }
        ],
        series: [
          {
            name: "",
            type: "pictorialBar",
            symbolSize: [30, 10],
            symbolOffset: [0, -6], // 上部椭圆
            symbolPosition: "end",
            z: 12,
            // "barWidth": "0",
            label: {
              normal: {
                show: true,
                position: "top",
                fontSize: fontChart(12),
                fontWeight: "bold",
                color: "#69DDFA"
                // background:"ur"
              }
            },
            color: "#2DB1EF",
            data: yData
          },
          {
            name: "",
            type: "pictorialBar",
            symbolSize: [30, 10],
            symbolOffset: [0, 0], // 下部椭圆
            // "barWidth": "20",
            z: 12,
            color: "rgba(43, 67, 165, 0.5)",
            data: yData
          },
          {
            type: "bar",
            //silent: true,
            barWidth: "30",
            barGap: "10%", // Make series be overlap
            barCateGoryGap: "10%",
            itemStyle: {
              normal: {
                color: new echarts.graphic.LinearGradient(0, 0, 0, 0.7, [
                  {
                    offset: 0,
                    color: "rgba(82, 180, 249, 1)"
                  },
                  {
                    offset: 1,
                    color: "rgba(43, 67, 165, 0.35)"
                  }
                ]),
                opacity: 0.8
              }
            },
            data: yData
          }
        ]
      };
      let myChart = this.$echarts.init(this.$refs.workLineChart);
      if (myChart) {
        myChart.setOption(option, true);
        window.addEventListener("resize", function() {
          myChart.resize();
        });
      }
      // var current = -1;
      // var dataLen1 = option.series[0].data.length;
      // setInterval(() => {
      //   // 取消之前高亮的图形
      //   myChart.dispatchAction({
      //     type: "downplay",
      //     seriesIndex: 0,
      //     dataIndex: current
      //   });
      //   current = (current + 1) % dataLen1;
      //   // 高亮当前图形
      //   myChart.dispatchAction({
      //     type: "highlight",
      //     seriesIndex: 0,
      //     dataIndex: current
      //   });
      //   // 显示 tooltip
      //   myChart.dispatchAction({
      //     type: "showTip",
      //     seriesIndex: 0,
      //     dataIndex: current
      //   });
      // }, 2000);
      //   this.setIntervals(option, myChart)
    },

    // 协作工作受理分析下钻数据
    tooltipEchartData(name, value) {
      let params = Object.assign({}, this.params);
      params.secondTag = name;
      //协作工作受理分析下钻
      getAction("/getSecondCollaborative", params).then(res => {
        let arr = res.data.collaborativeList;
        // console.log(arr, "协作工作受理分析下钻");
        let Data = [];
        let title = name + "  " + "总数 : " + value + "次";
        if (arr.length > 0) {
          arr.forEach(item => {
            let obj = { value: item.count, name: item.dataType };
            Data.push(obj);
          });
        }
        this.$nextTick(() => {
          if (!document.getElementById("tooltipChart")) return;
          let myChart = this.$echarts.init(
            document.getElementById("tooltipChart")
          );
          // this.myChartTwo.clear();
          this.setTooltipEchart(Data, title, myChart);
        });
      });
    },

    // 协作工作受理分析圆柱形 点击出现饼图
    setTooltipEchart(data, titleText, myChart) {
      const colorList = [
        {
          x: 0,
          y: 0,
          x2: 0,
          y2: 1,
          colorStops: [
            {
              offset: 1,
              color: "#006AFF" // 0% 处的颜色
            },
            {
              offset: 0,
              color: "#8CE2FF" // 100% 处的颜色
            }
          ]
        },
        {
          x: 0,
          y: 0,
          x2: 0,
          y2: 1,
          colorStops: [
            {
              offset: 0,
              color: "#92F092" // 0% 处的颜色
            },
            {
              offset: 1,
              color: "#4BB84B" // 100% 处的颜色
            }
          ]
        },
        {
          x: 0,
          y: 0,
          x2: 0,
          y2: 1,
          colorStops: [
            {
              offset: 0,
              color: "#8BA7D8" // 0% 处的颜色
            },
            {
              offset: 1,
              color: "#8FABDA" // 100% 处的颜色
            }
          ]
        },
        {
          x: 0,
          y: 0,
          x2: 0,
          y2: 1,
          colorStops: [
            {
              offset: 0,
              color: "#22B3FF" // 0% 处的颜色
            },
            {
              offset: 1,
              color: "#62C6FA" // 100% 处的颜色
            }
          ]
        }
      ];
      let option = {
        color: colorList,
        title: {
          text: titleText,
          show: true, // 是否显示标题,默认 true。
          padding: [10, 0, 5, 0],
          textStyle: {
            color: "white",
            fontSize: fontChart(16),
            fontFamily: "Alibaba PuHuiTi",
            fontWeight: 600
          },
          left: "center"
        },

        tooltip: {
          trigger: "item",
          show: false,
          borderColor: "rgba(255,255,255,.3)",
          backgroundColor: "rgba(13,5,30,.6)",
          borderWidth: 1,
          padding: 5,
          textStyle: {
            color: "#fff"
          }
        },
        legend: {
          // orient: "vertical",
          bottom: 10,
          // right: 5,
          itemWidth: 20,
          itemHeight: 10,
          itemGap: 15,
          borderRadius: 4,
          textStyle: {
            color: "white",
            fontFamily: "Alibaba PuHuiTi",
            fontSize: fontChart(16),
            fontWeight: 400
          }
        },

        series: [
          {
            name: "",
            type: "pie",
            radius: ["0%", "40%"],
            center: ["45%", "50%"],
            itemStyle: {
              //边框
              borderWidth: 0,
              borderColor: "#15213F"
            },
            // avoidLabelOverlap: false,
            label: {
              show: true,
              formatter: e => {
                return "{value|" + e.value + "%" + "}\n{name|" + e.name + "}";
              },
              rich: {
                // 改变标示文字的颜色
                name: {
                  color: "#F0F0F0",
                  fontSize: fontChart(16)
                },
                value: {
                  color: "#F0F0F0",
                  fontSize: fontChart(18)
                }
              }
            },
            labelLine: {
              show: true
            },
            data: data
          }
        ]
      };
      // this.myChartTwo.setOption(option);
      myChart.setOption(option);
    },


 194
194


 被折叠的 条评论
为什么被折叠?
被折叠的 条评论
为什么被折叠?
 到【灌水乐园】发言


