


this.myChartArr[0].mychart = echarts.init(document.getElementById("mychart1"))
this.myChartArr[0].data = [
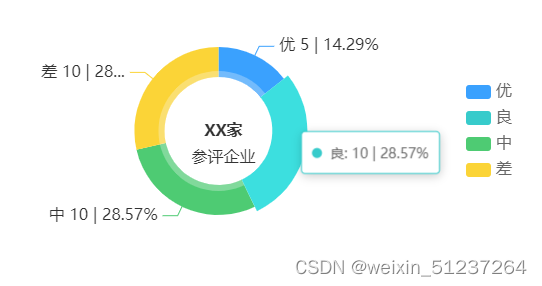
{
name: "优",
value: 5,
},
{
name: "良",
value: 10,
},
{
name: "中",
value: 10,
},
{
name: "差",
value: 10,
},
];
let option = {
tooltip: {
trigger: 'item',
formatter: (params) => {
return params.marker + ' ' + params.name + ': ' + params.value + ' | ' + params.percent + '%'
}
},
color: [
"#3AA1FE",
"#37CBCB",
"#4ECB73",
"#FBD437",
"rgba(250,250,250,0.3)",
],
title: {
text: "XX家",
subtext: '参评企业',
textStyle: {
color: "#333",
fontSize: 16,
},
subtextStyle: {
fontSize: 16,
color: ["#666"],
},
left: "40%",
top: "45%",
textAlign:'center',
},
legend: {
orient: "vertical",
top: "middle",
right: "5",
textStyle: {
color: "#666",
fontSize: 16,
},
icon: "roundRect",
data: this.myChartArr[0].data,
},
series: [
// 主要展示层的
{
radius: ["45%", "70%"],
center: ["40%", "50%"],
type: "pie",
label: {
normal: {
show: true,
formatter: "{b} {c} | {d}%",
textStyle: {
fontSize: 16,
},
position: "outside",
},
emphasis: {
show: true,
},
},
labelLine: {
normal: {
show: true,
length: 10,
length2: 15,
},
emphasis: {
show: true,
},
},
name: "园区企业评价等级",
data: this.myChartArr[0].data,
},
// 边框的设置
{
radius: ["45%", "50%"],
center: ["40%", "50%"],
type: "pie",
label: {
normal: {
show: false,
},
emphasis: {
show: false,
},
},
labelLine: {
normal: {
show: false,
},
emphasis: {
show: false,
},
},
animation: false,
tooltip: {
show: false,
},
data: [
{
value: 1,
itemStyle: {
color: "rgba(250,250,250,0.3)",
},
},
],
},
],
}
this.myChartArr[0].mychart.setOption(option) 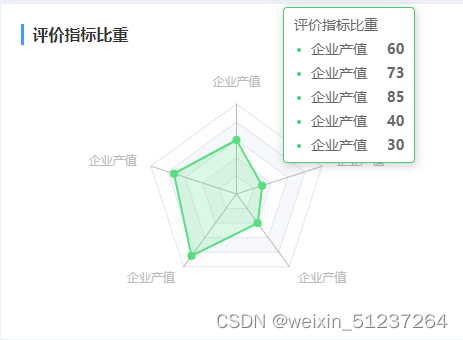
this.tableData2 = [
        {
          prop1: '企业产值',
          prop2: '66',
          prop3: '100',
          prop4: '0.66',
        },
        {
          prop1: '企业利润',
          prop2: '55',
          prop3: '100',
          prop4: '0.55',
        },
        {
          prop1: '营业收入',
          prop2: '44',
          prop3: '100',
          prop4: '0.44',
        }
      ]
      this.myChartArr[2].indicator = [
        { text: '企业产值', max: 100 },
        { text: '企业产值', max: 100 },
        { text: '企业产值', max: 100 },
        { text: '企业产值', max: 100 },
        { text: '企业产值', max: 100 }
      ];
      this.myChartArr[2].data = [60, 73, 85, 40, 30]

this.myChartArr[2].mychart = echarts.init(document.getElementById("mychart3"))

      var option = {
        tooltip: {
          trigger: 'axis'
        },
        radar: [
          {
            indicator: this.myChartArr[2].indicator,
            center: ['50%', '50%'],
            radius: 90
          }
        ],
        series: [
          {
            type: 'radar',
            tooltip: {
              trigger: 'item'
            },
            areaStyle: {
              normal: {
                opacity: 0.2,
                color: '#4ECB73'
              },
            },
            itemStyle: {
              normal: {
                  borderWidth: 1,
                  color: '#4ECB73'
              }
            },
            data: [
              {
                value: this.myChartArr[2].data,
                name: '评价指标比重'
              }
            ]
          }
        ]
      };
      this.myChartArr[2].mychart.setOption(option)


 2680
2680


 被折叠的 条评论
为什么被折叠?
被折叠的 条评论
为什么被折叠?
 到【灌水乐园】发言


