


当我们使用扇形图时会发现在一些情况下图形会改变样式。
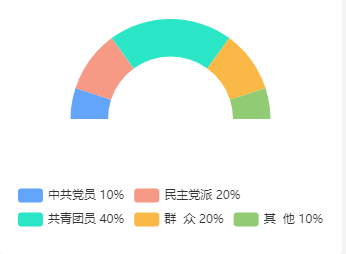
这是设置的扇形:
出现的bug情况:
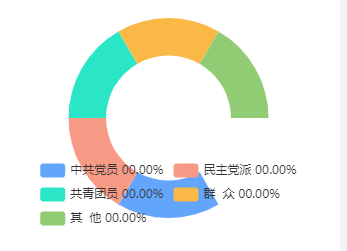
仔细观察一下就会发现貌似出现问题时所有的数据都是0。这也就是出现问题的原因。因此我们进行判断当所有数据都为0时,可以隐藏该图案,显示暂无数据字样以及其他解决办法。
<div id="ceshi" style="height:250px; width: 100%;"></div>vue项目中使用echarts记得在main.js中添加并install。
main.js:
import * as echarts from 'echarts';当前页面:
<script>
import * as echarts from 'echarts';

......
</script>
创建该扇形的方法:
addEcharts() {
      var myChart = this.$echarts.init(document.getElementById("ceshi"));
      var option = {
        tooltip: {
          trigger: 'item'
        },
        grid: {
          left: "3%",
          right: "3%",
          bottom: "3%",
          containLabel: true
        },
        legend: {
          bottom: '5%',
          left: 'center'
        },
        series: [
          {
            name: "测试",
            type: "pie",
            //起始刻度的角度,默认为 90 度,即圆心的正上方。0 度为圆心的正右方。
            startAngle: 0,
            hoverAnimation: false,
            label: {
              show: false,
              position: 'center'
            },
            tooltip: {},
            radius: ["50%", "80%"],
            // center: ["40%", "40%"],
            labelLine: {
              normal: {
                show: false
              }
            },
            data: [
              {
                value: this.PolitiveSum,    //这里是获取的动态数据(总数)
                itemStyle: {
                  normal: {
                    color: "rgba(80,150,224,0)"
                  }
                }
              },
              {
                value: this.Politive[0],  //这里是获取的动态数据(数据1)
                name: '中共党员 '+this.PolitiveBfb[0]+'%', //对应百分比
                itemStyle: {
                  normal: {
                    color: "#63a5fb"
                  }
                },
              },
              {
                value: this.Politive[1], //这里是获取的动态数据(数据2)
                name: '民主党派 '+this.PolitiveBfb[1]+'%', //对应百分比
                itemStyle: {
                  normal: {
                    color: "#f69a85"
                  }
                }
              },
              {
                value: this.Politive[2], //这里是获取的动态数据(数据3)
                name: '共青团员 '+this.PolitiveBfb[2]+'%', //对应百分比
                itemStyle: {
                  normal: {
                    color: "#2ae5c6"
                  }
                }
              },
              {
                value: this.Politive[3], //这里是获取的动态数据(数据4)
                name: '群  众 '+this.PolitiveBfb[3]+'%', //对应百分比
                itemStyle: {
                  normal: {
                    color: "#fab847"
                  }
                }
              },
              {
                value: this.Politive[4], //这里是获取的动态数据(数据5)
                name: '其  他 '+this.PolitiveBfb[4]+'%', //对应百分比
                itemStyle: {
                  normal: {
                    color: "#91cc75"
                  }
                }
              },
            ]
          }
        ]
      };
      myChart.setOption(option);        //绘制图形
    },


 4936
4936


 被折叠的 条评论
为什么被折叠?
被折叠的 条评论
为什么被折叠?
 到【灌水乐园】发言


