


利用树形图展示数据、父组件中使用props传值,传递展示的数据、线条颜色、布局方式等
1 组件效果展示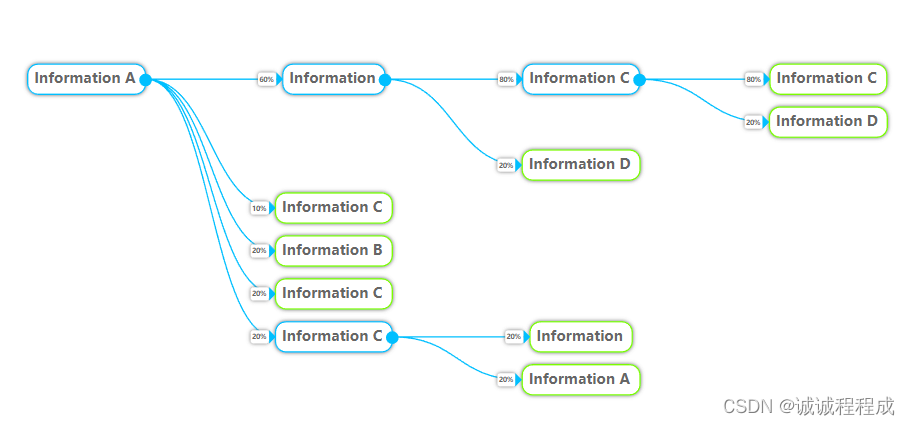

2 使用组件步骤
2.1在项目中引用G6
Step 1: 使用命令行在项目目录下执行以下命令:
npm install --save @antv/g6
Step 2: 在需要用的 G6 的 JS 文件中导入:
import G6 from '@antv/g6';
Step 3: 在 HTML 中使用 CDN 引入
// version <= 3.2
<script src="https://gw.alipayobjects.com/os/antv/pkg/_antv.g6-{$version}/build/g6.js"></script>
// version >= 3.3
<script src="https://gw.alipayobjects.com/os/lib/antv/g6/{$version}/dist/g6.min.js"></script>
// version >= 4.0
<script src="https://gw.alipayobjects.com/os/lib/antv/g6/4.3.11/dist/g6.min.js"></script>
⚠️ 注意:
在 {$version} 中填写版本号,例如 3.7.1;
2.2 ctrl c + ctrl v此自定义组件
复制博主的自定义组件代码(treeDiagram)到自己的项目中
代码在文章最下面
2.3 引用组件treeDiagram
2.3.1 引用组件
import treeDiagram from '@/components/treeDiagram/treeDiagram.vue';
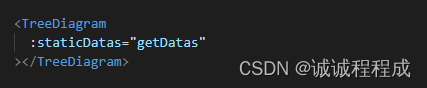
2.3.2 参数说明

2.3.3 传入的数据举例
getDatas: {
        "name": "Information A",
        "children": [
          {
            "name": "Information",
            "percentage": "60%",
            "children": [
              {
                "name": "Information C",
                "percentage": "80%",
                "children": [
                  {
                    "name": "Information C",
                    "percentage": "80%"
                  },
                  {
                    "name": "Information D",
                    "percentage": "20%"
                  }
                ]
              },
              {
                "name": "Information D",
                "percentage": "20%"
              }
            ]
          },
          {
            "name": "Information C",
            "percentage": "10%"
          },
          {
            "name": "Information B",
            "percentage": "20%"
          },
          {
            "name": "Information C",
            "percentage": "20%"
          },
          {
            "name": "Information C",
            "percentage": "20%",
            "children": [
              {
                "name": "Information",
                "percentage": "20%"
              },
              {
                "name": "Information A",
                "percentage": "20%"

              }
            ]
          }
        ]
      }
2.3.4 完整代码
<template>
    <div class="main-content-box">
      <div id="container"></div>
    </div>
</template>

  <script>
  import G6 from '@antv/g6';

  export default {
    name: 'treeDiagram',
    props: {
        staticDatas: {
          type: Object,
          required: true
        },
        //线条颜色
        lineColor: {
          type: String,
          default: "#00BFFF"
        },
        //布局
        treeDirection: {
          type: String,
          default: "LR"
        },
        //有孩子节点的标签边框颜色
        strokeColor1: {
          type: String,
          default: "#00BFFF"
        },
        //无孩子节点的标签边框颜色
        strokeColor2: {
          type: String,
          default: "#7CFC00"
        },
        // 文字颜色
        textColor: {
          type: String,
          default: "#666"
        }
    },
    data () {
      return {

      }
    },
    mounted() {
      this.getInit();
    },
    methods: {
      getInit () {
        let vm = this;
        G6.registerNode('tree-node', {
          drawShape: function drawShape(cfg, group) {
            // console.log(cfg)
            // --------------------标签内容节点----------------------
            let hasChildren = cfg.children && cfg.children.length > 0;   // 是否有孩子节点
            let strokeColor =  hasChildren == true ? vm.strokeColor1 : vm.strokeColor2;     // 有无孩子节点 的边框颜色不同
            // 节点设置
            const rect = group.addShape('rect', {
              attrs: {
                fill: '#fff',
                stroke: strokeColor,  // 边框颜色
                lineWidth: 1,       // 边框粗细
                radius: 8,
                shadowBlur: 15,
                shadowColor: '#666',
                // shadowOffsetX: 2,
                // shadowOffsetY: 2
              },
              name: 'rect-shape',
            });
            // 文本设置
            const text = group.addShape('text', {
              attrs: {
                text: cfg.name,       // 赋值name属性
                fontFamily: 'normal',
                fontSize: 11,
                fontWeight: 800,
                x: 0,
                y: 0,
                textAlign: 'left',
                textBaseline: 'middle',
                fill: vm.textColor
              },
              name: 'text-shape',
            });

            const bbox = text.getBBox();   // 获得文本的盒子 之后的两个节点的xy轴坐标参考bbox
            //const minbbox = rect.getBBox();
            // 设置 rect方框和text文本 的 x y坐标轴
            // rect主节点的长度由其中的文本影响
            rect.attr({
              x: -bbox.width / 2 - 5,
              y: -bbox.height,
              // width: bbox.width + (hasChildren ? 20 : 12),
              width: bbox.width +  12 ,
              height: bbox.height + 8,
            });
            text.attr({
              x: -bbox.width / 2,
              y: -bbox.height / 2 + 3,
            })

            // -----------百分比节点----------
            var hasPercentage = cfg.percentage;
            var rect2 = 0;
            if(hasPercentage){
                // 节点设置 2
                rect2 = group.addShape('rect', {
                attrs: {
                    fill: '#fff',
                    stroke: '',  // 边框颜色
                    lineWidth: 0,       // 边框粗细
                    radius: 2,
                    shadowBlur: 15,
                    shadowColor: '#666'
                },
                name: 'rect-shape2',
              });
              // 文本设置 2
              const text2 = group.addShape('text', {
              attrs: {
                  text: cfg.percentage,       // 赋值name属性
                  fontFamily: 'normal',
                  fontSize: 5,
                  fontWeight: 700,
                  textAlign: 'left',
                  textBaseline: 'middle',
                  fill: '#666'
                },
                name: 'text-shape2',
              });
              // 设置坐标轴和宽高
              rect2.attr({
                  x: -bbox.width / 2 - 24,
                  y: -bbox.height / 2 - 1,
                  width: 14,
                  height: 10,
              });
              text2.attr({
                  x: -bbox.width / 2 - 23,
                  y: -bbox.height / 2 + 4,
              })
              // -------连接两个节点的小节点----------
              // const rect3 = group.addShape('rect', {
              //     attrs: {
              //         fill: '#00BFFF',
              //         stroke: '',  // 边框颜色
              //         lineWidth: 0,       // 边框粗细
              //         shadowBlur: 0,
              //         shadowColor: '',
              //     },
              //     name: 'rect-shape3',
              // });
              // rect3.attr({
              //     x: -bbox.width / 2 - 24 + 14,   // 即:rect的坐标 + rect的宽
              //     y: -bbox.height / 4 + 1,
              //     width: 4,
              //     height: 4
              // });
              // -------连接两个节点的小节点 三角形----------
              // 需要设置svg才能使用
              group.addShape('dom', {
                attrs: {
                  x: -bbox.width / 2 - 24 + 14,   // 即:rect的坐标 + rect的宽
                  y: -bbox.height / 2 - 1,
                  width: 10,
                  height: 10,
                  html: `
                  <div style="border-left: 5px solid #00BFFF;
                              border-right: 5px solid transparent;
                              border-top: 5px solid transparent;
                              border-bottom: 5px solid transparent;">
                  </div>
                    `,
                },
                draggable: true,
              });
            }


            // 小圆圈
            if (hasChildren) {
              const redcircle = group.addShape('marker', {
                  attrs: {
                  symbol: cfg.collapsed ? G6.Marker.expand : G6.Marker.collapse,
                  // symbol: cfg.collapsed ? COLLAPSE_ICON : EXPAND_ICON,
                  stroke: '#00BFFF',
                  fill: '#00BFFF',
                  lineWidth: 1.8,
                },
                name: 'collapse-icon',
              });
              redcircle.attr({
                  x: bbox.width / 2 + 7,
                  y: -3 ,
                  r: 4,

              })
            }


            return rect;
          },
          update: (cfg, item) => {
            const group = item.getContainer();
            const icon = group.find((e) => e.get('name') === 'collapse-icon');
            icon.attr('symbol', cfg.collapsed ? G6.Marker.expand : G6.Marker.collapse);
          },
        },
        'single-node',
      );

      const container = document.getElementById('container');
      const width = container.scrollWidth;
      const height = container.scrollHeight || 500;

      const graph = new G6.TreeGraph({
        renderer : 'svg',     // 创建自定义DMO时定义 会报一个错 但好像不影响
        container: 'container',
        width,
        height,
        modes: {
          default: [
            {
              type: 'collapse-expand',
              onChange: function onChange(item, collapsed) {
                const data = item.get('model');
                graph.updateItem(item, {
                  collapsed,
                });
                data.collapsed = collapsed;
                return true;
              },
            },
            'drag-canvas',    // 拖动
            'zoom-canvas',    // 收缩
          ],
        },
        defaultNode: {
          type: 'tree-node',
          anchorPoints: [
            [0, 0.5],
            [1, 0.5],
          ],
        },
        // 设置边的参数
        defaultEdge: {
          type: 'cubic-horizontal',
          style: {
            stroke: this.lineColor
          },
        },
        layout: {
            type: 'indented',
            direction: this.treeDirection,
            dropCap: false,
            indent: 190,
            getHeight: () => {
              return 13;
            },
            getVGap: function getVGap () {
              return 10;
            },
        },
      });


      graph.data(this.staticDatas);
      graph.render();
      graph.fitView();

      if (typeof window !== 'undefined')
        window.onresize = () => {
          if (!graph || graph.get('destroyed')) return;
          if (!container || !container.scrollWidth || !container.scrollHeight) return;
          graph.changeSize(container.scrollWidth, container.scrollHeight);
        };
      },


    }
  }

  </script>

  <style scoped>
  </style>


 4470
4470


 被折叠的 条评论
为什么被折叠?
被折叠的 条评论
为什么被折叠?
 到【灌水乐园】发言


