


交互式地图是一种动态地图,允许用户在一定程度上对其进行控制,如放缩、高亮等,其比例尺根据用户的操作可以实时变化。在R语言中,也有一些工具包可以生成交互式地图。本篇介绍的mapview工具包就是其中之一。
mapview工具包的优势在于快捷,它的核心函数就是与包同名的mapView()函数或mapview()函数。
在不设置任何参数时,该函数也可以运行,结果如下:
library(mapview)
mapview()
breweries是该包自带的一个点状sf格式的矢量数据。使用mapview()函数可以将其在交互式地图中进行展示:
mapView(breweries)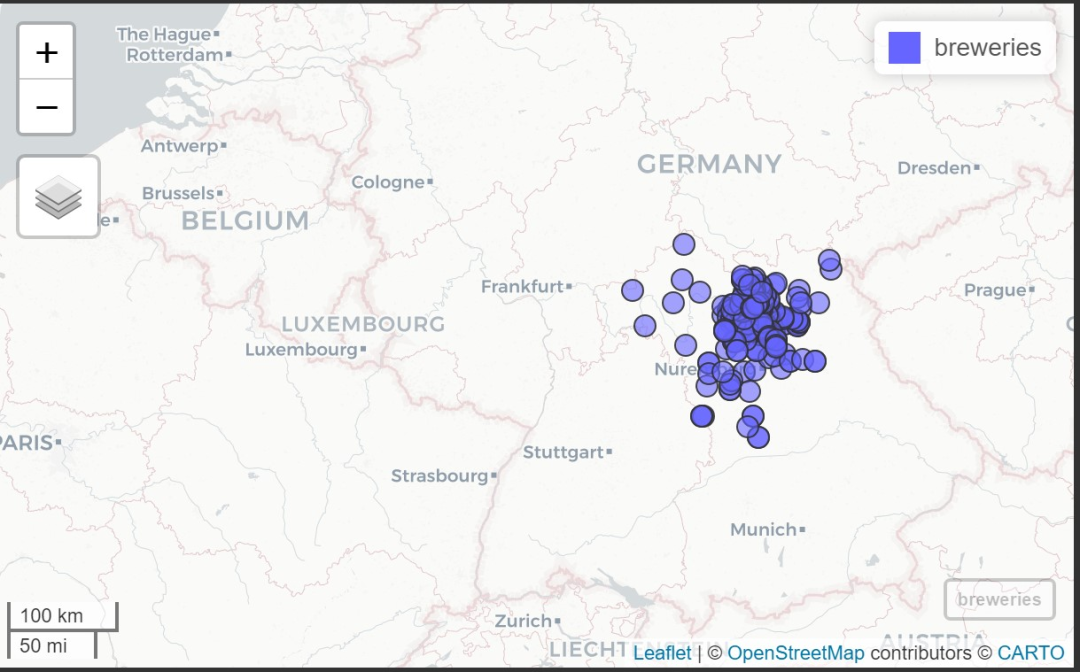
mapView()函数有许多参数,并且针对矢量数据、栅格数据等对象具有不同的 参数,具体可查看官方文档。
针对sf对象的语法结构:
mapView(
  x,
  map = NULL,
  pane = "auto",
  canvas = useCanvas(x),
  viewer.suppress = mapviewGetOption("viewer.suppress"),
  zcol = NULL,
  burst = FALSE,
  color = mapviewGetOption("vector.palette"),
  col.regions = mapviewGetOption("vector.palette"),
  at = NULL,
  na.color = mapviewGetOption("na.color"),
  cex = 6,
  lwd = lineWidth(x),
  alpha = 0.9,
  alpha.regions = regionOpacity(x),
  na.alpha = regionOpacity(x),
  map.types = mapviewGetOption("basemaps"),
  verbose = mapviewGetOption("verbose"),
  popup = TRUE,
  layer.name = NULL,
  label = zcol,
  legend = mapviewGetOption("legend"),
  legend.opacity = 1,
  homebutton = mapviewGetOption("homebutton"),
  native.crs = FALSE,
  highlight = mapviewHighlightOptions(x, alpha.regions, alpha, lwd),
  maxpoints = getMaxFeatures(x),
  ...
)
添加颜色
mapview(franconia,
        color = "black",
        col.regions = "blue",
        alpha.regions = 0.2) ## 设置透明度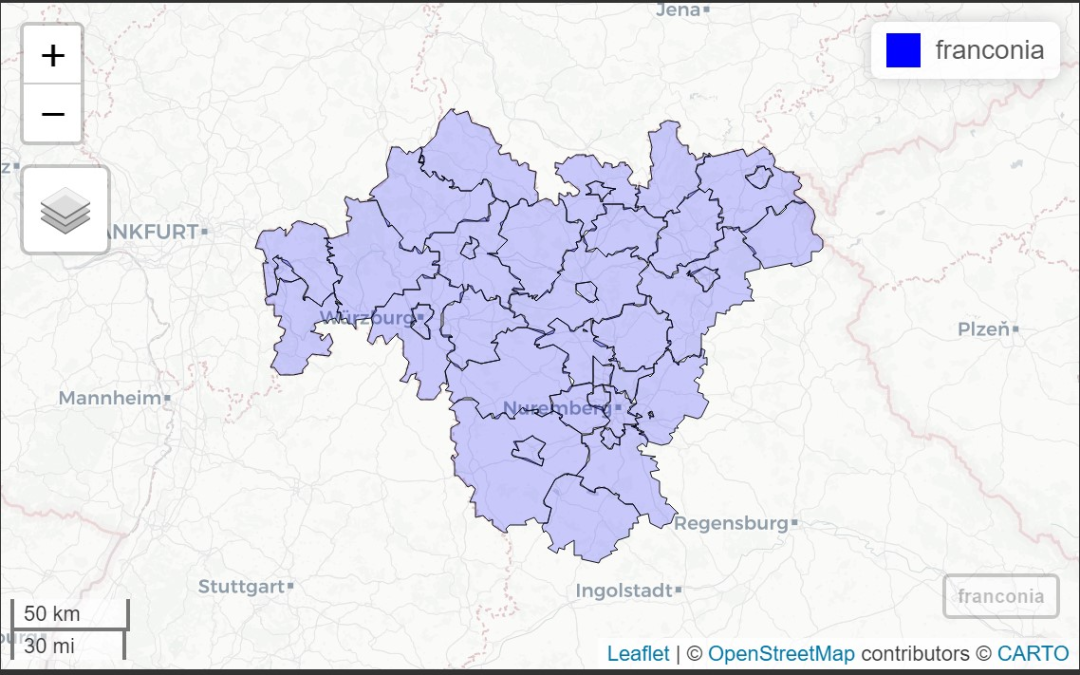
根据属性上色
mapview(franconia,
        zcol = "district")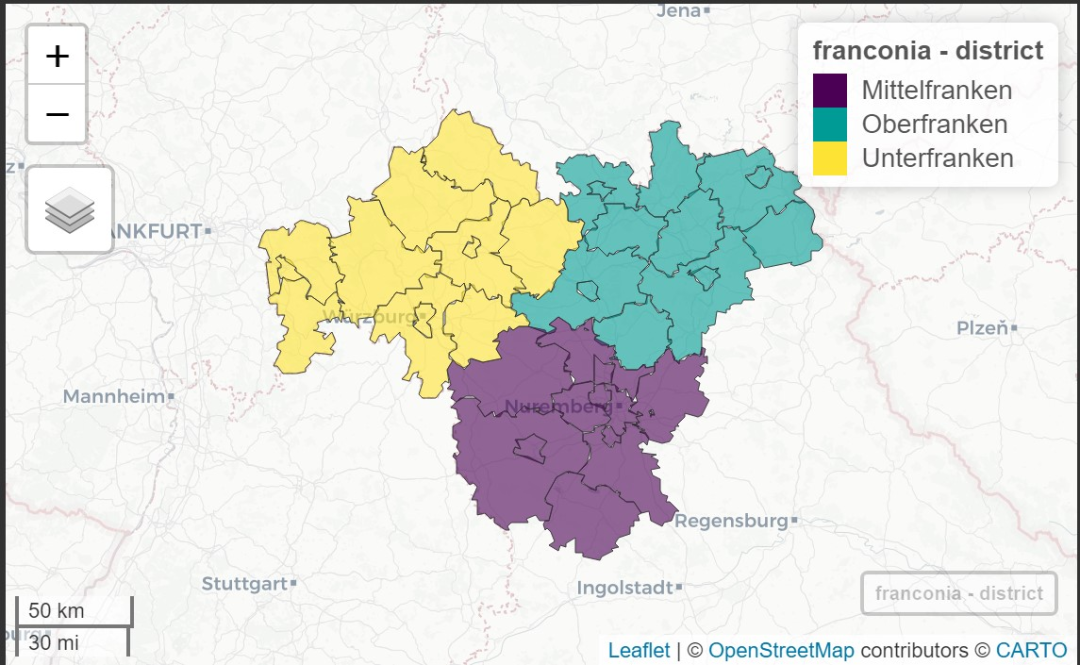
展示由空间数据构成的列表
mapview(list(franconia, breweries),
          zcol = list("district", NULL),
          legend = list(TRUE, FALSE)) ## 是否显示图例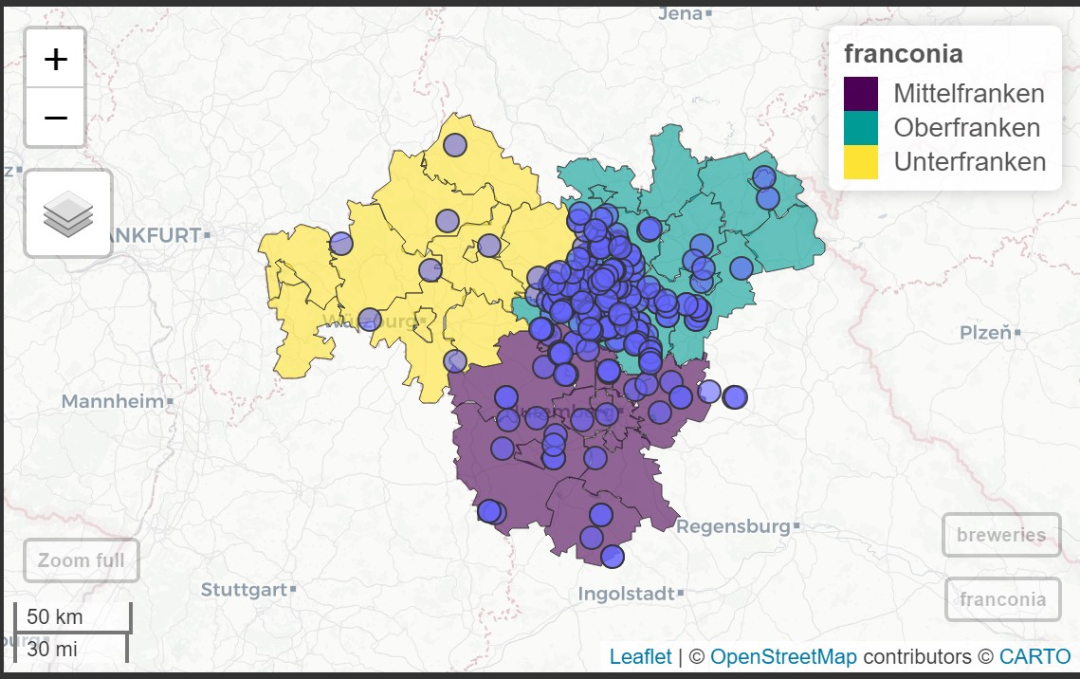
使用加号
+进行图层叠加
mapview(franconia) +
  mapview(breweries)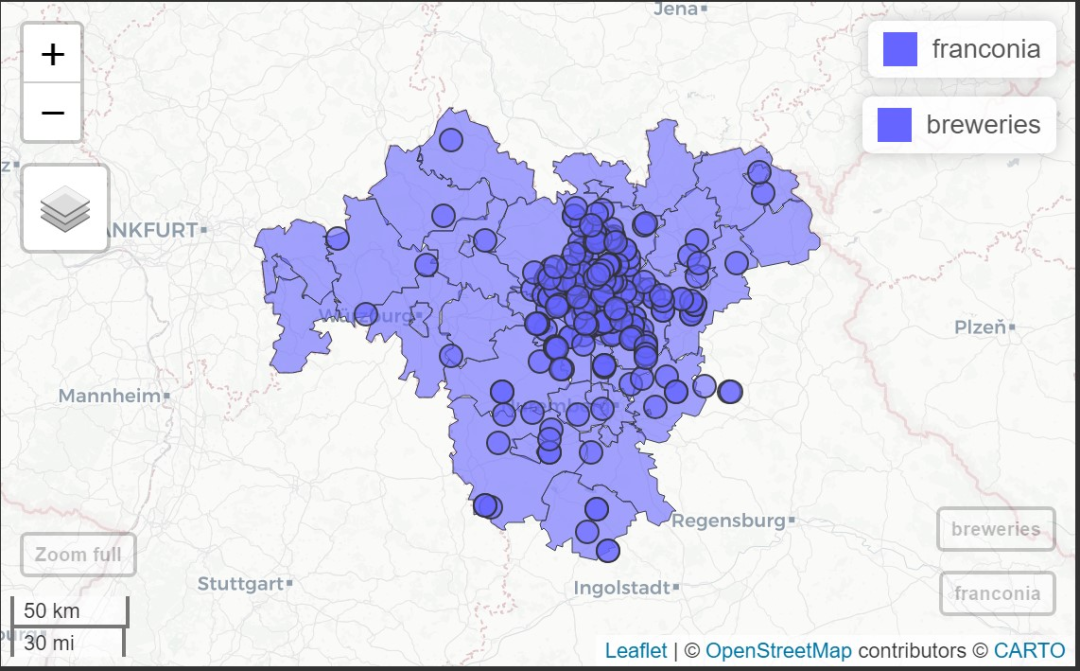
特别说明
mapview工具包默认使用的背景地图是OpenStreetMap,其中中国边界线存在许多错误,因此需要慎重使用。


 5462
5462

 被折叠的 条评论
为什么被折叠?
被折叠的 条评论
为什么被折叠?
 到【灌水乐园】发言


