


专注系列化、高质量的R语言教程
tmap是R语言中比较专业的地理绘图工具包。前面已经有一期推文介绍了它的基础功能,详见tmap | R语言中专门绘制地图的工具包。
本篇再来介绍两个功能:制作地图动画和放大局部区域(二者没有必然联系,只是内容较少放在同一篇推文中)。
1 制作地图动画
本部分主要参考的是《Geocomputation with R》9.3节[1]的内容。
示例数据是来自spData工具包中的urban_agglomerations。这是一个长数据:一个城市聚集区对应多行数据,每行对应一个年份。
library(spData)
head(urban_agglomerations, 5)
##   index year rank\norder country\ncode country_or_area city_code
## 1     1 1950           6            32       Argentina     20058
## 2     2 1955           5            32       Argentina     20058
## 3     3 1960           6            32       Argentina     20058
## 4     4 1965           5            32       Argentina     20058
## 5     5 1970           5            32       Argentina     20058
##   urban_agglomeration note population_millions             geometry
## 1        Buenos Aires    1            5.166140 -58.40037, -34.60508
## 2        Buenos Aires    1            5.910271 -58.40037, -34.60508
## 3        Buenos Aires    1            6.761837 -58.40037, -34.60508
## 4        Buenos Aires    1            7.548511 -58.40037, -34.60508
## 5 Buenos Aires 1 8.416170 -58.40037, -34.60508在进行绘图时,可以根据year变量进行分面。tm_facets()函数有两种分面方式:
by参数:普通分面;所有分面位于同一绘图页面;along参数:每个分面占据一个独立的绘图页面。
我们在这里使用along参数进行分面:
library(sf)
library(tmap)
urb_anim <- tm_shape(st_union(world)) +
tm_polygons() +
tm_shape(urban_agglomerations) +
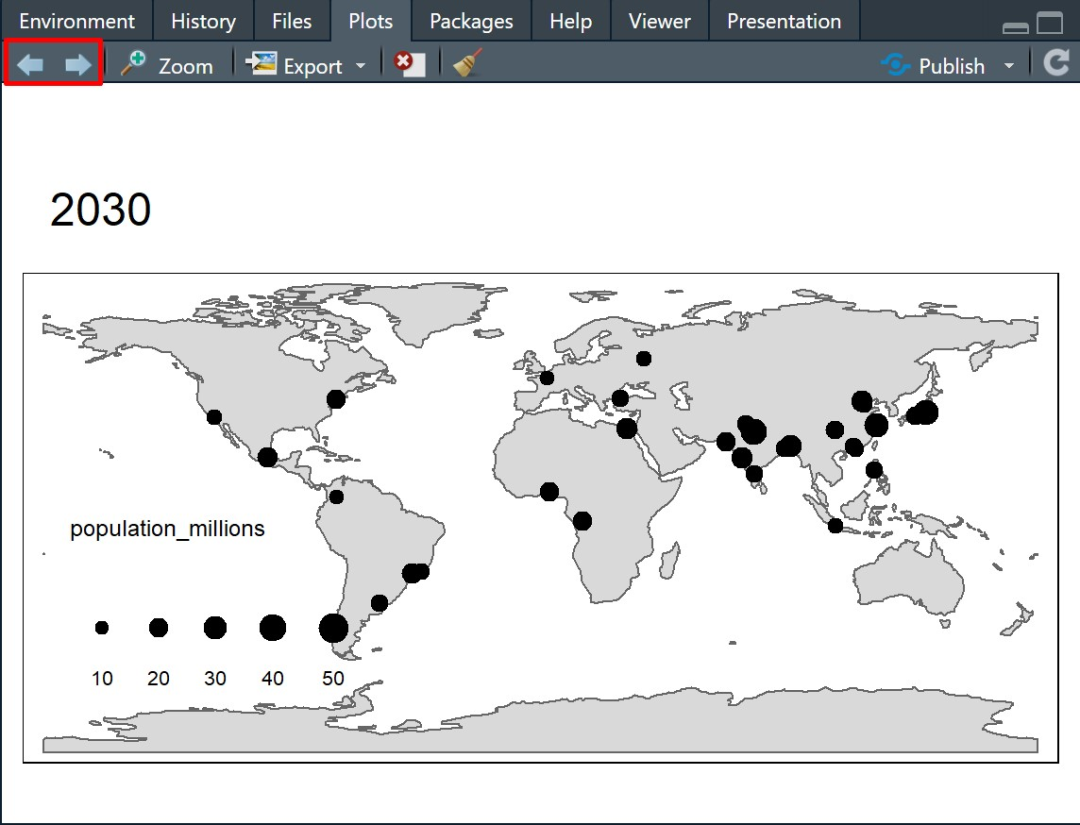
tm_dots(size = "population_millions") +
tm_facets(along = "year", free.coords = FALSE)
urb_anim在绘图窗口,可以通过点击如下红框内的左、右箭头切换分面:
再运行类似下面的语句,就可在本地保存地图动画:
tmap_animation(urb_anim, filename = "E:/urb_anim.gif", delay = 25)若提示
Package gifski is required for gif animations but not installed,请先安装gifski工具包。
2 放大局部区域
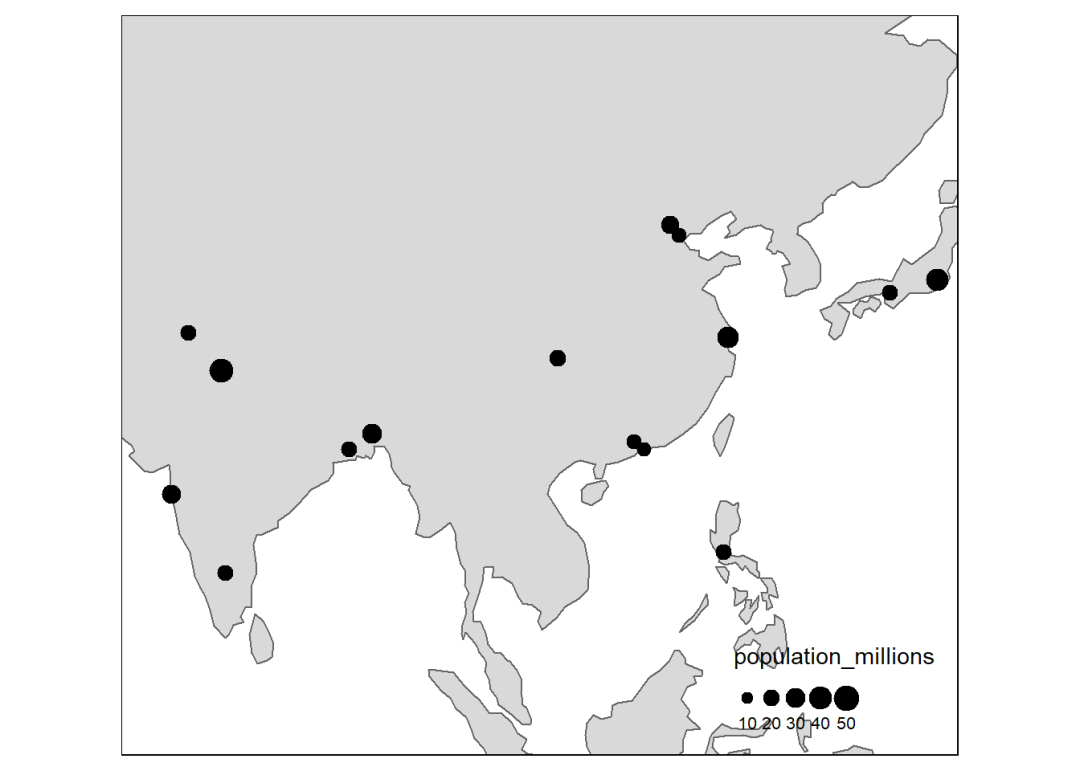
放大局部区域的方法也很简单,只需要指定tm_shape()函数的bbox参数即可:
urban_2035 <- subset(urban_agglomerations, year == "2035")
bb <- st_bbox(urban_agglomerations)
bb[1:4] <- c(70, 0, 140, 55)
bb
## xmin ymin xmax ymax
##   70    0  140   55

tm_shape(st_union(world), bbox = bb) +
  tm_polygons() +
  tm_shape(urban_agglomerations) +
  tm_dots(size = "population_millions")
bb中的四个元素分布表示经、纬度的下限和上限值。
参考资料
[1]
Geocomputation with R: https://geocompr.robinlovelace.net/adv-map.html#prerequisites-6


 被折叠的 条评论
为什么被折叠?
被折叠的 条评论
为什么被折叠?
 到【灌水乐园】发言


